

Imaging Anatomy Abdomen Case 1
This is a 51 year old patient with vague upper abdominal pain after eating. Try to reason out the answers to questions prior to revealing the explanations.
Question 1:
a) What is this study and what are three pertinent technical parameters to identify?
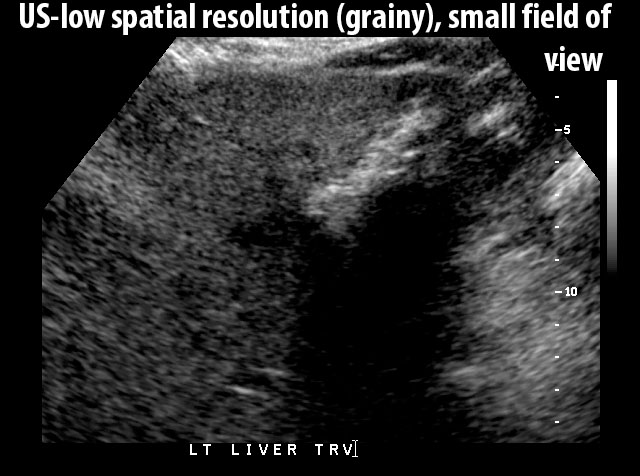
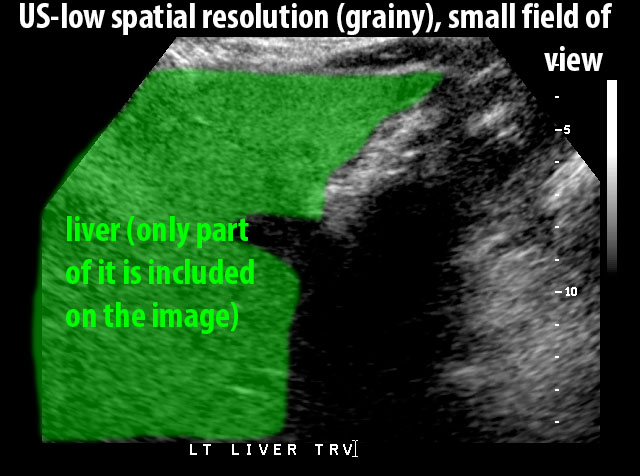
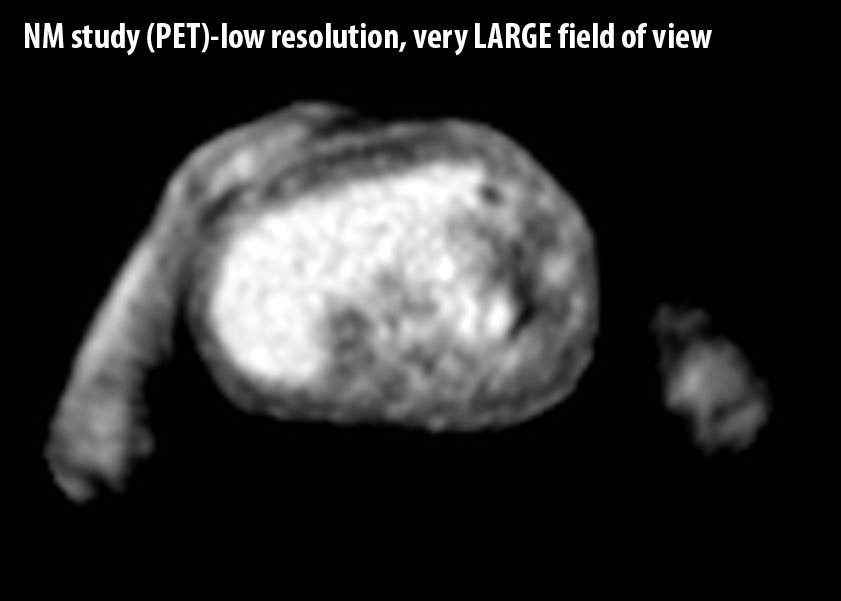
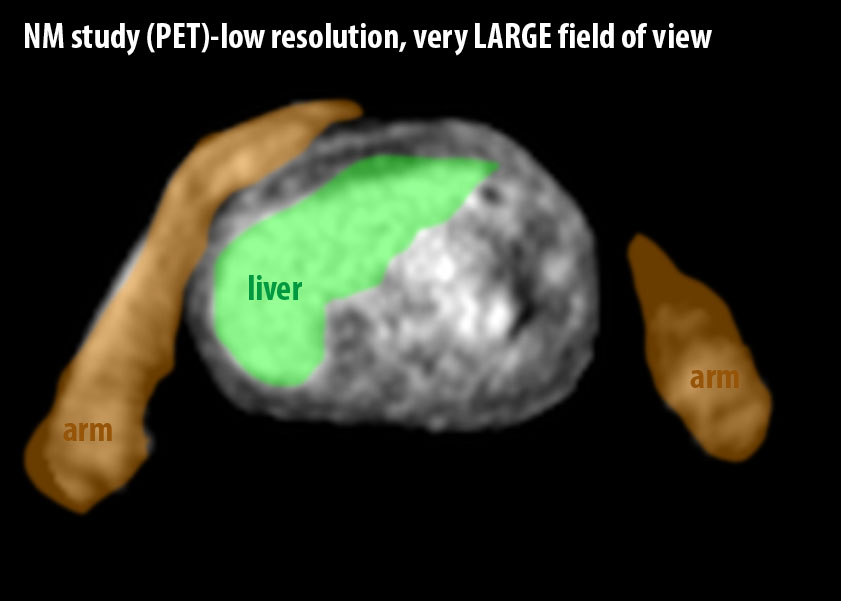
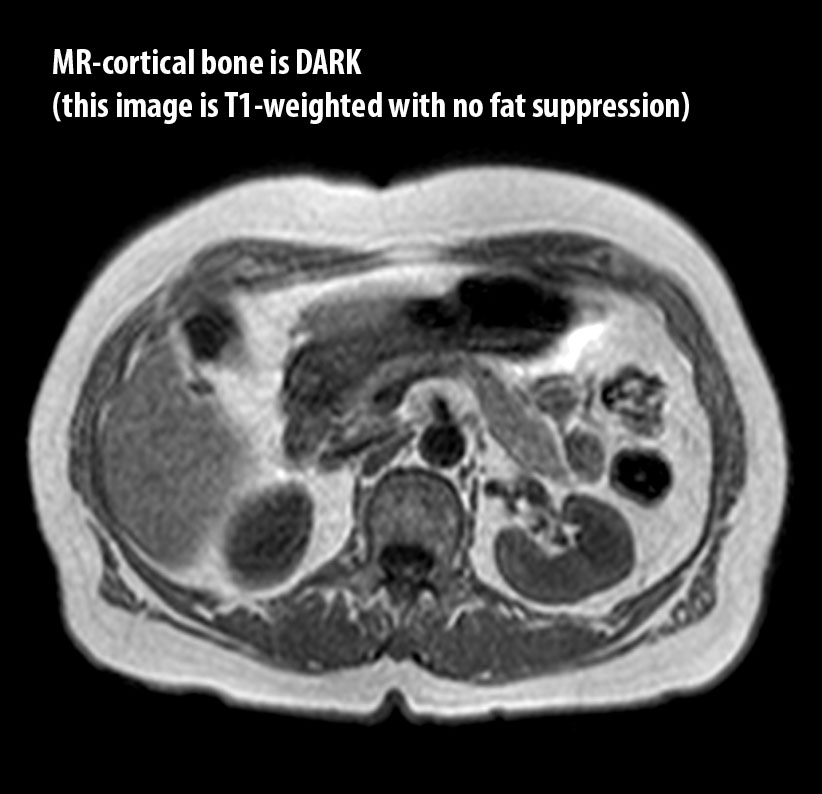
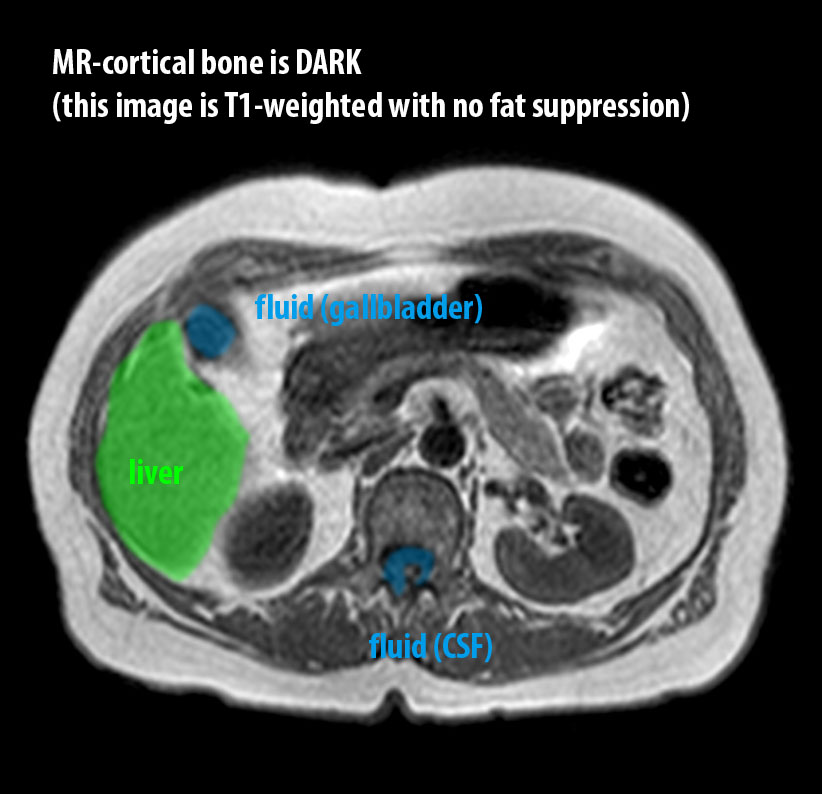
This is a CT scan --you can tell because it is clearly a sectional study (not a radiograph) and cortical bone is very white (not an MRI). Anatomic structures are clearer and the image includes a larger field of view than an ultrasound. There are many finer gradations of gray than would be seen on a nuclear medicine study. Comparisons for these other modalities are included below. Three pertinent technical parameters to note include the plane of section (axial, also called horizontal or transverse), display window (soft tissue), and whether there is oral or IV contrast present (yes, both are present).
b) What other imaging planes are shown below (Plane 1 and Plane 2)?
Plane 1 is coronal (slicing the body from ear to ear, with slices located toward the front or toward the back). Plane 2 is sagittal (slicing the body from nose to back of skull, with slices located toward the right or the left). These studies are normal. It is important to realize that some causes of abdominal pain (hepatitis, gastritis, reflux) may not show abnormalities on routine CT imaging. Processes that mainly involve the mucosa are often better evaluated with endoscopy.
stepwise approach to cross-sections:
1. what is it? (CT, MR, US, NM—look for cortical bone and fat, graininess, FOV)
2. what imaging plane? (axial/transverse/horizontal, sagittal, coronal, other)
3. for a CT, what contrast? (oral, IV, timing); what window? (lung, bone, ST, other)*
4. where are we? (look at bones, organs— lungs, heart, liver, kidneys, urinary bladder)
* for other modalities than CT, different technical factors should be assessed
Imaging Anatomy Abdomen Case 1
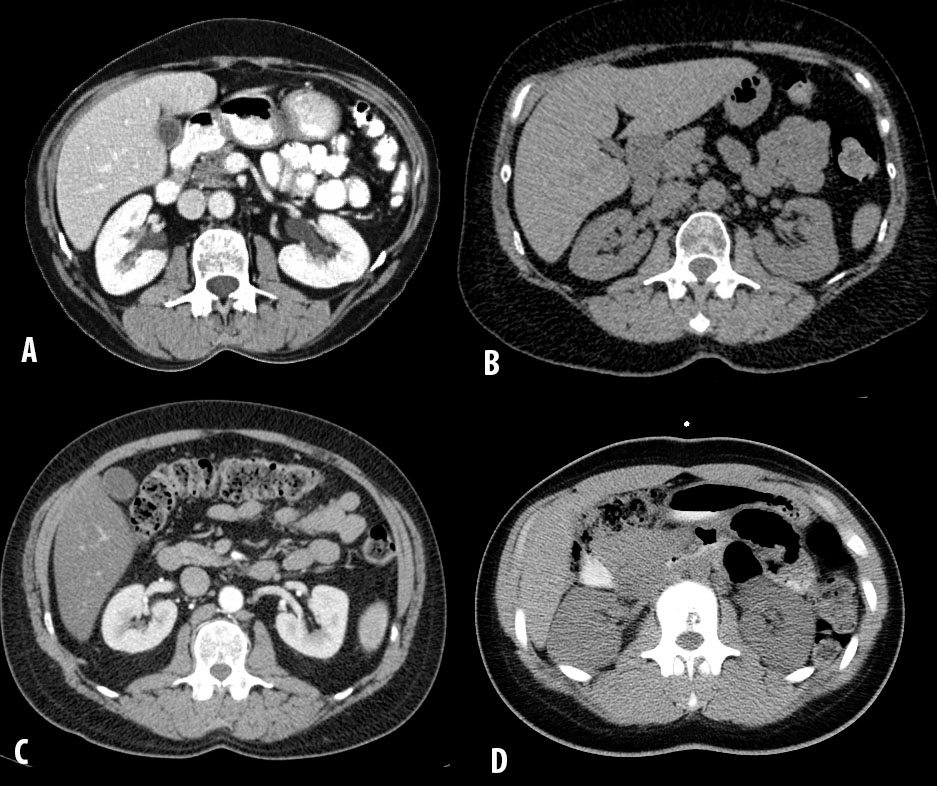
Here are images from four different patients with abdominal pain. All are axial slices displayed with soft tissue windows at similar levels within the body.
Question 2:
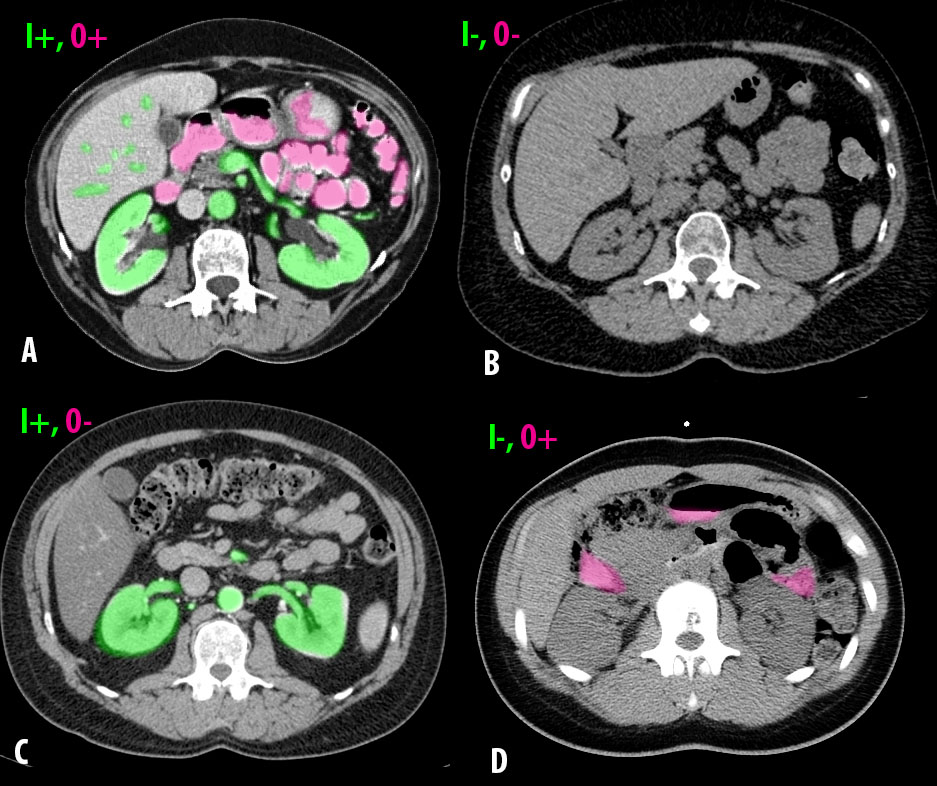
a) Decide for each image whether there is ORAL or IV contrast present.
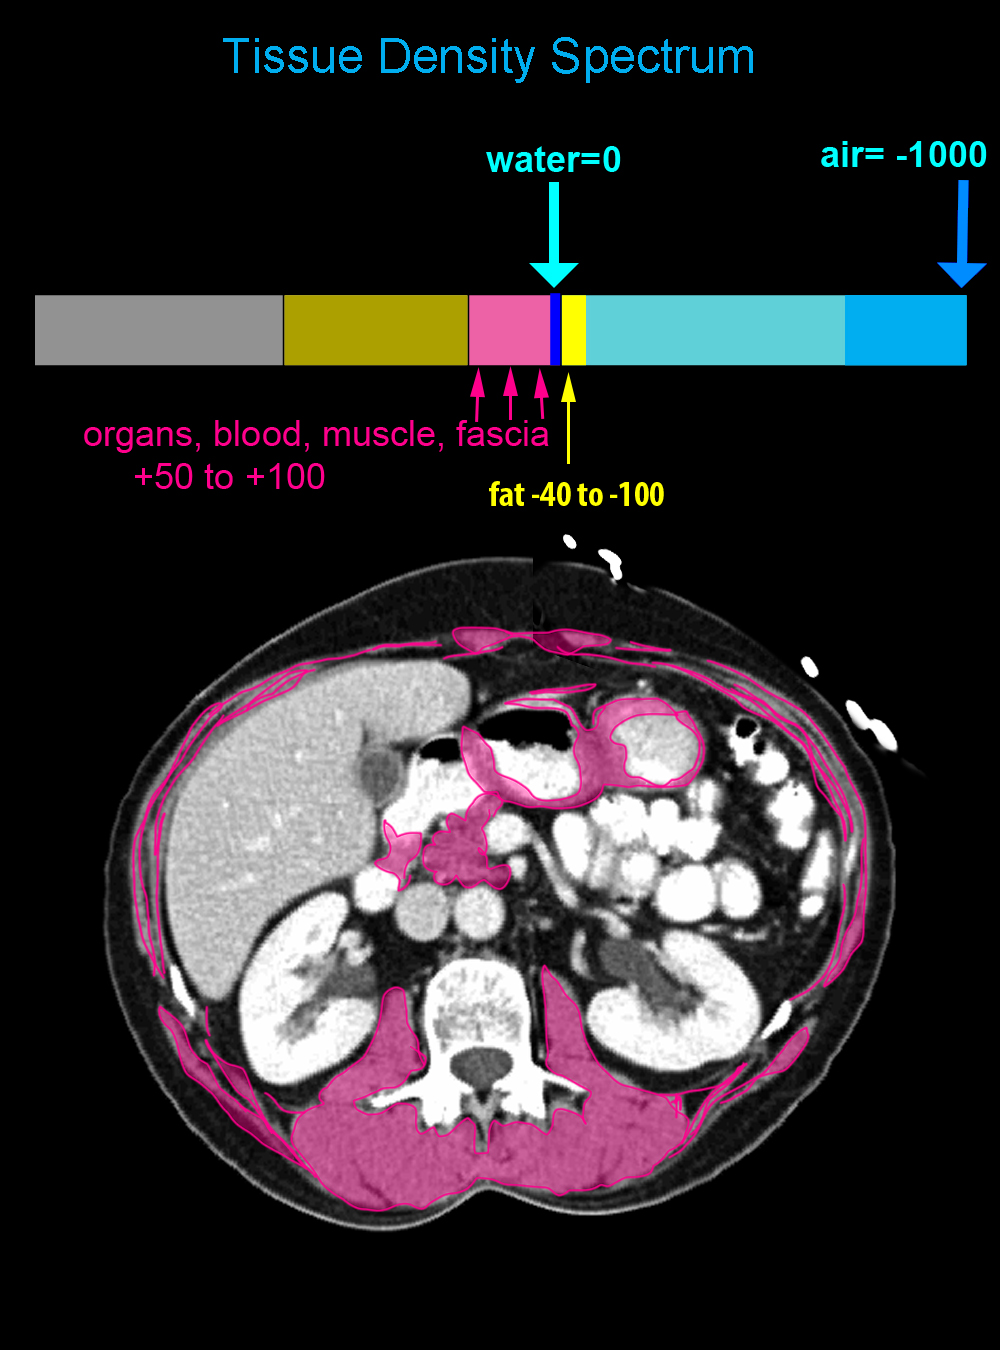
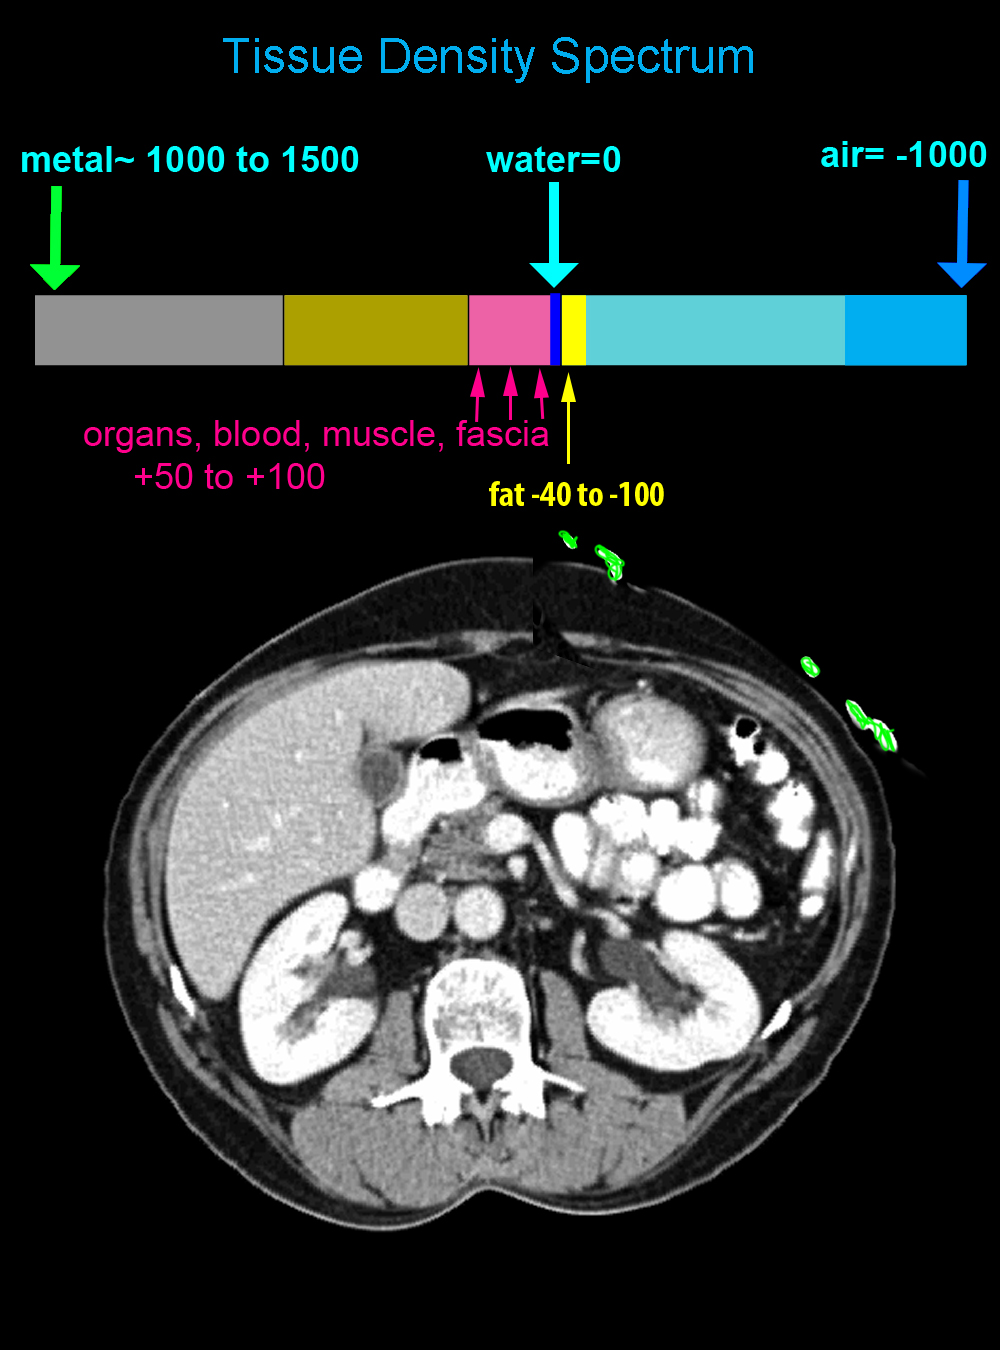
Image A has both oral (outlined in pink) and IV contrast (outlined in green) present. Image B has no oral or IV contrast. Image C has IV but no oral contrast. Image D has oral but no IV contrast.
b) What factors might affect the apparent density of oral or IV contrast on the images?
The density of oral contrast will depend on the concentration used, how much the patient was willing to drink, and over what time interval, since it will take time for the contrast in the stomach to make its way into the distal GI tract. If the patient vomits before the study, very little GI contrast will remain. The density of IV contrast will depend on the concentration administered, the rate of delivery of the contrast into the arm vein, and how long after injection the scan was obtained.
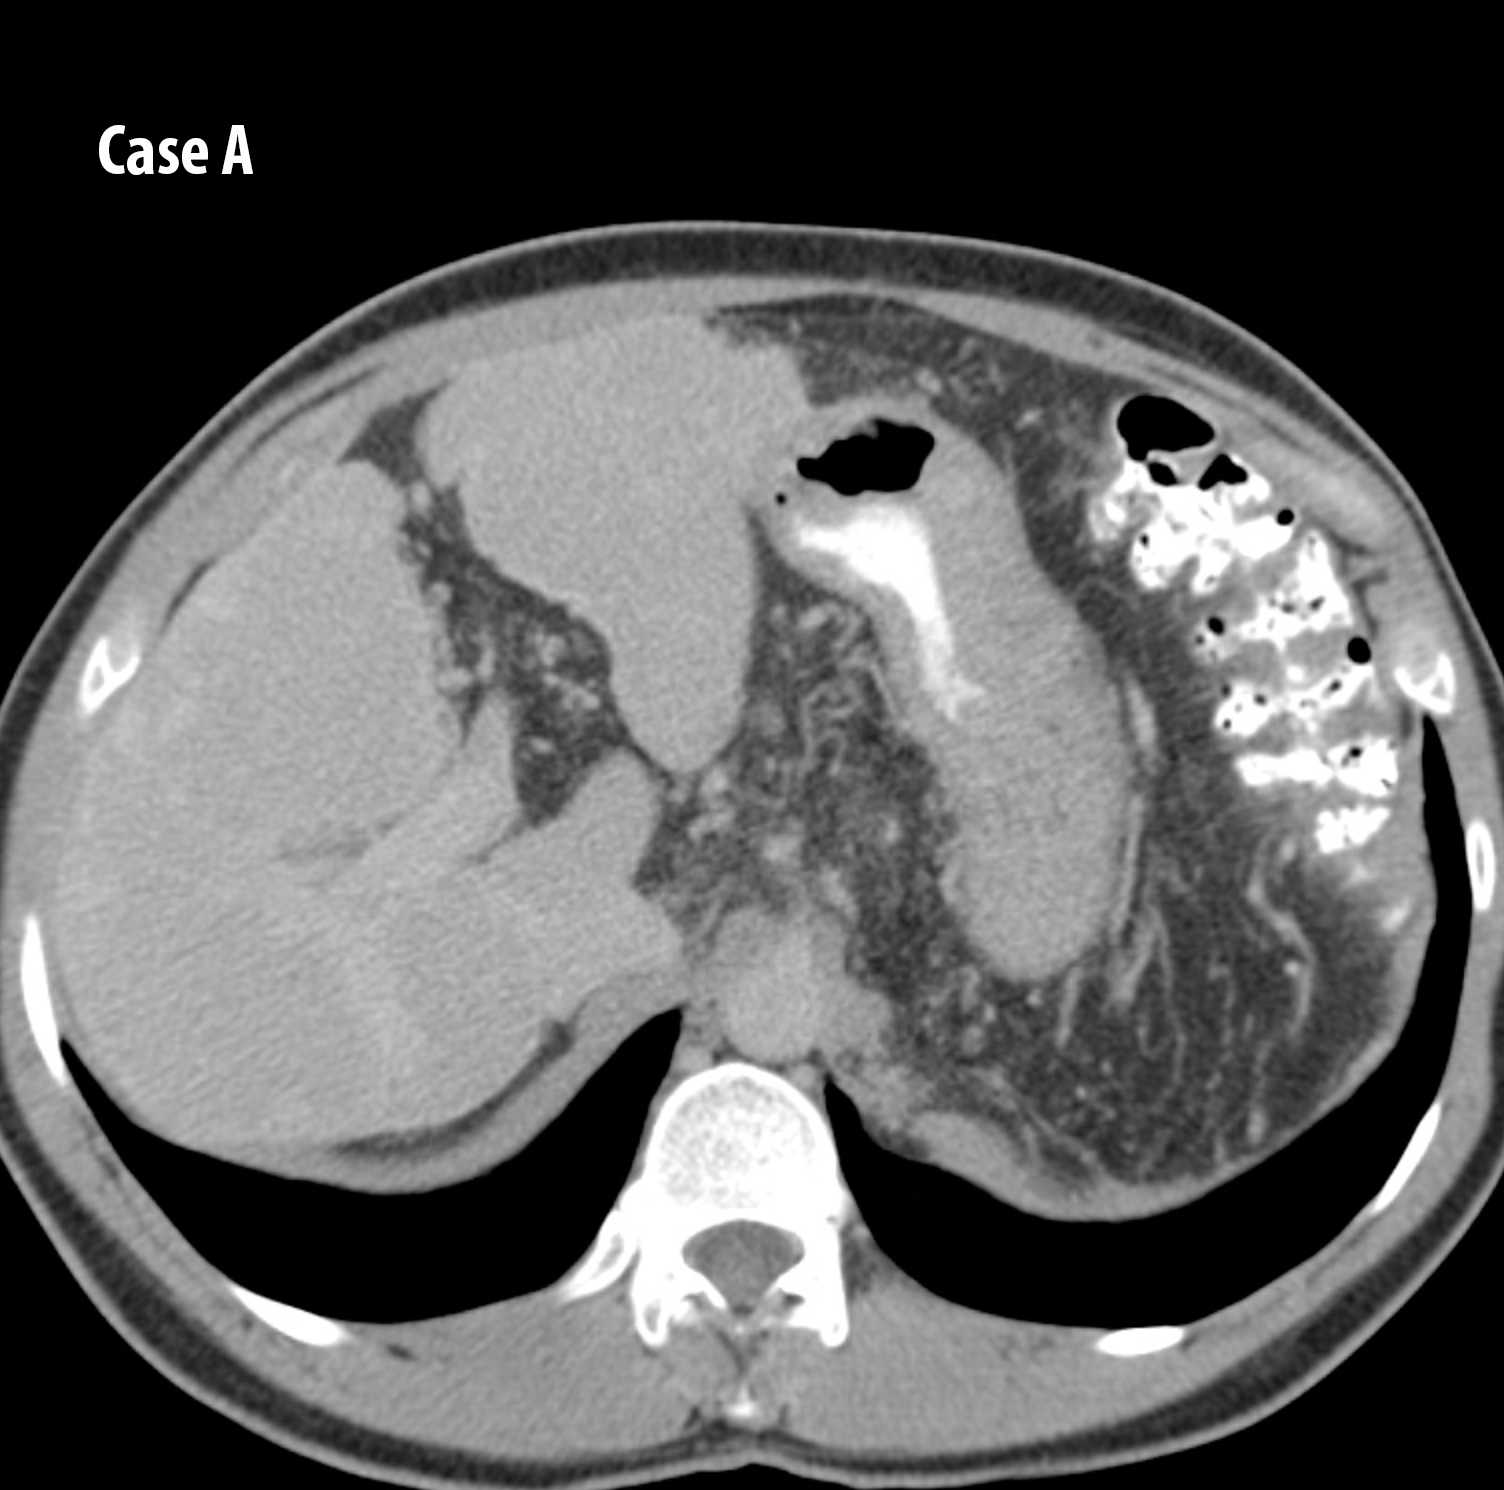
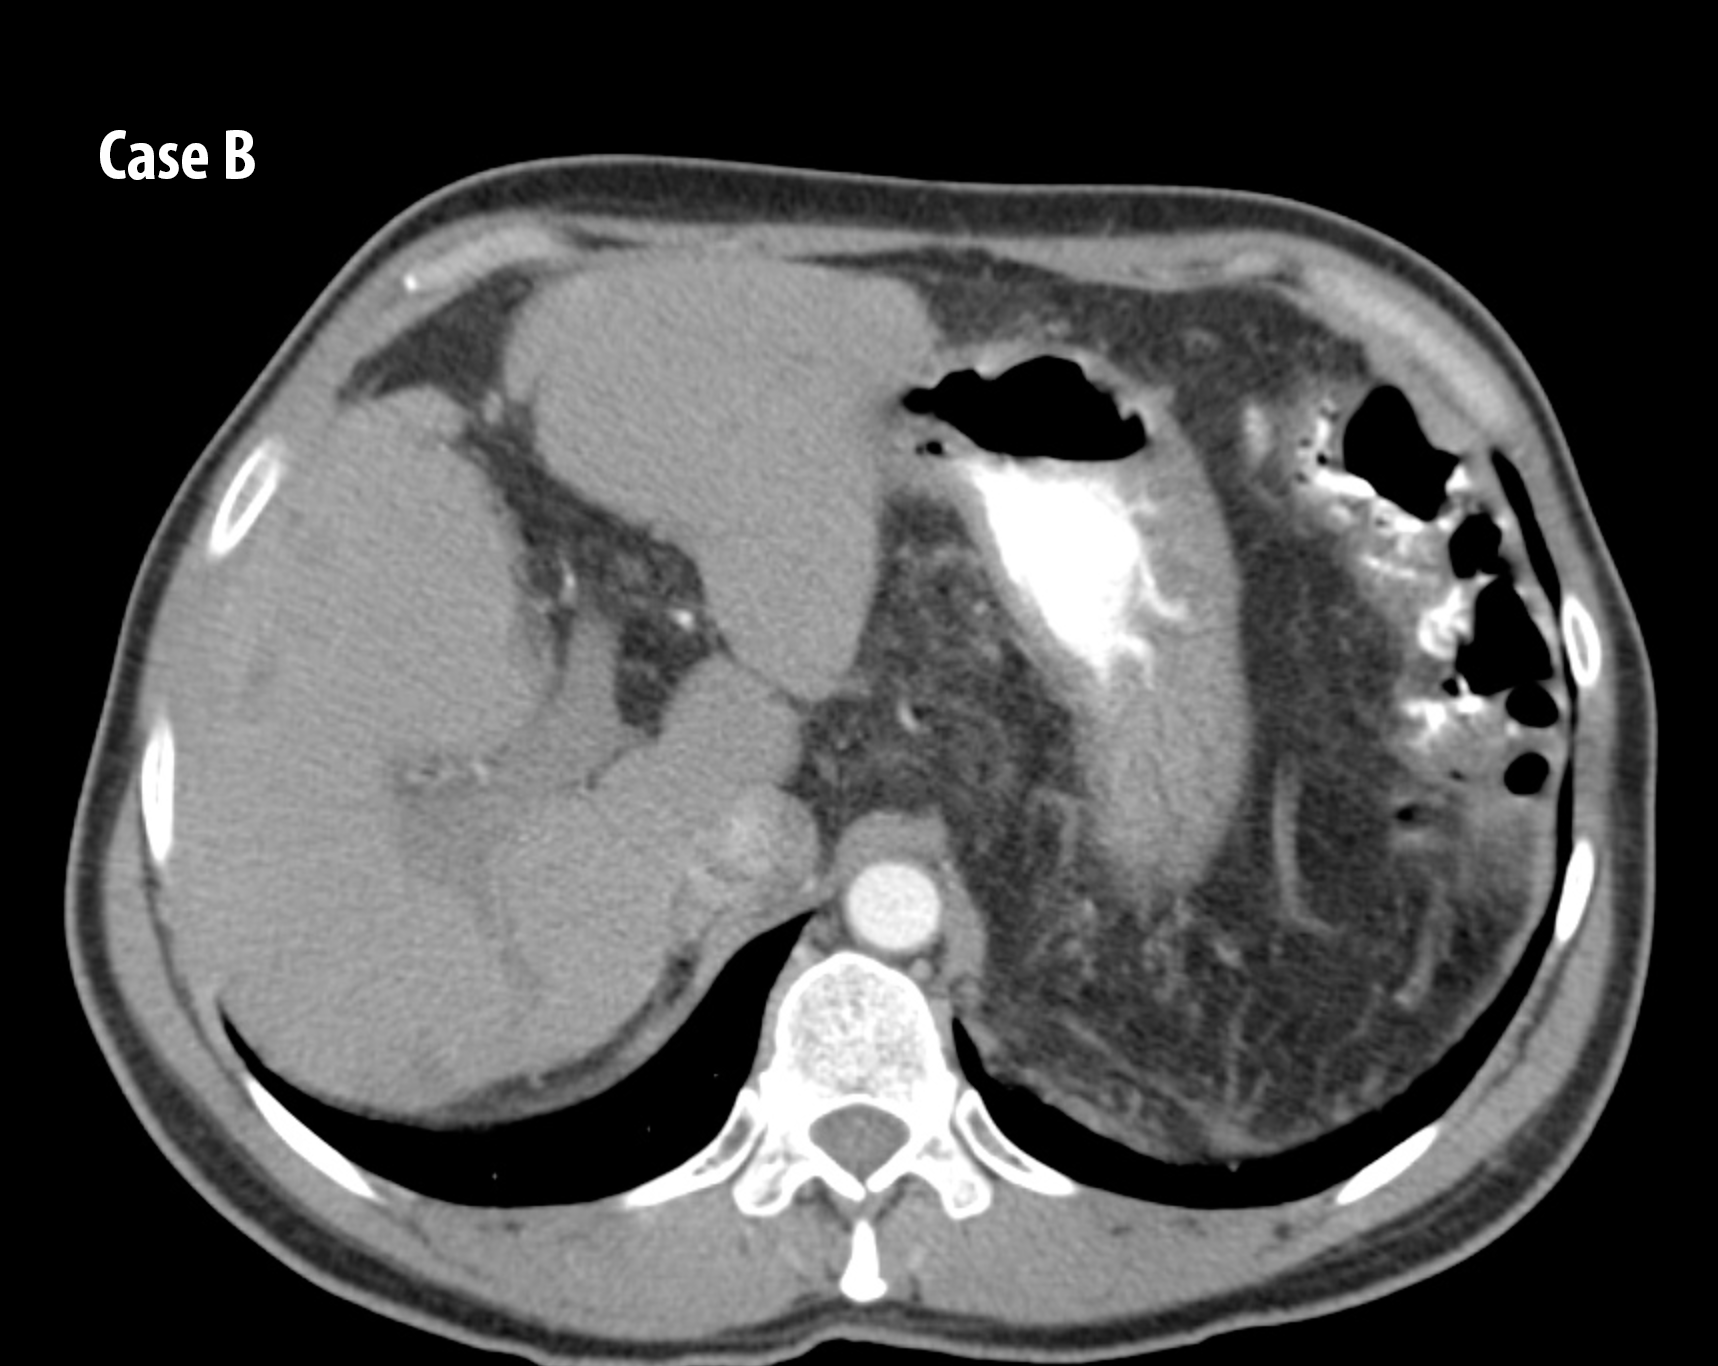
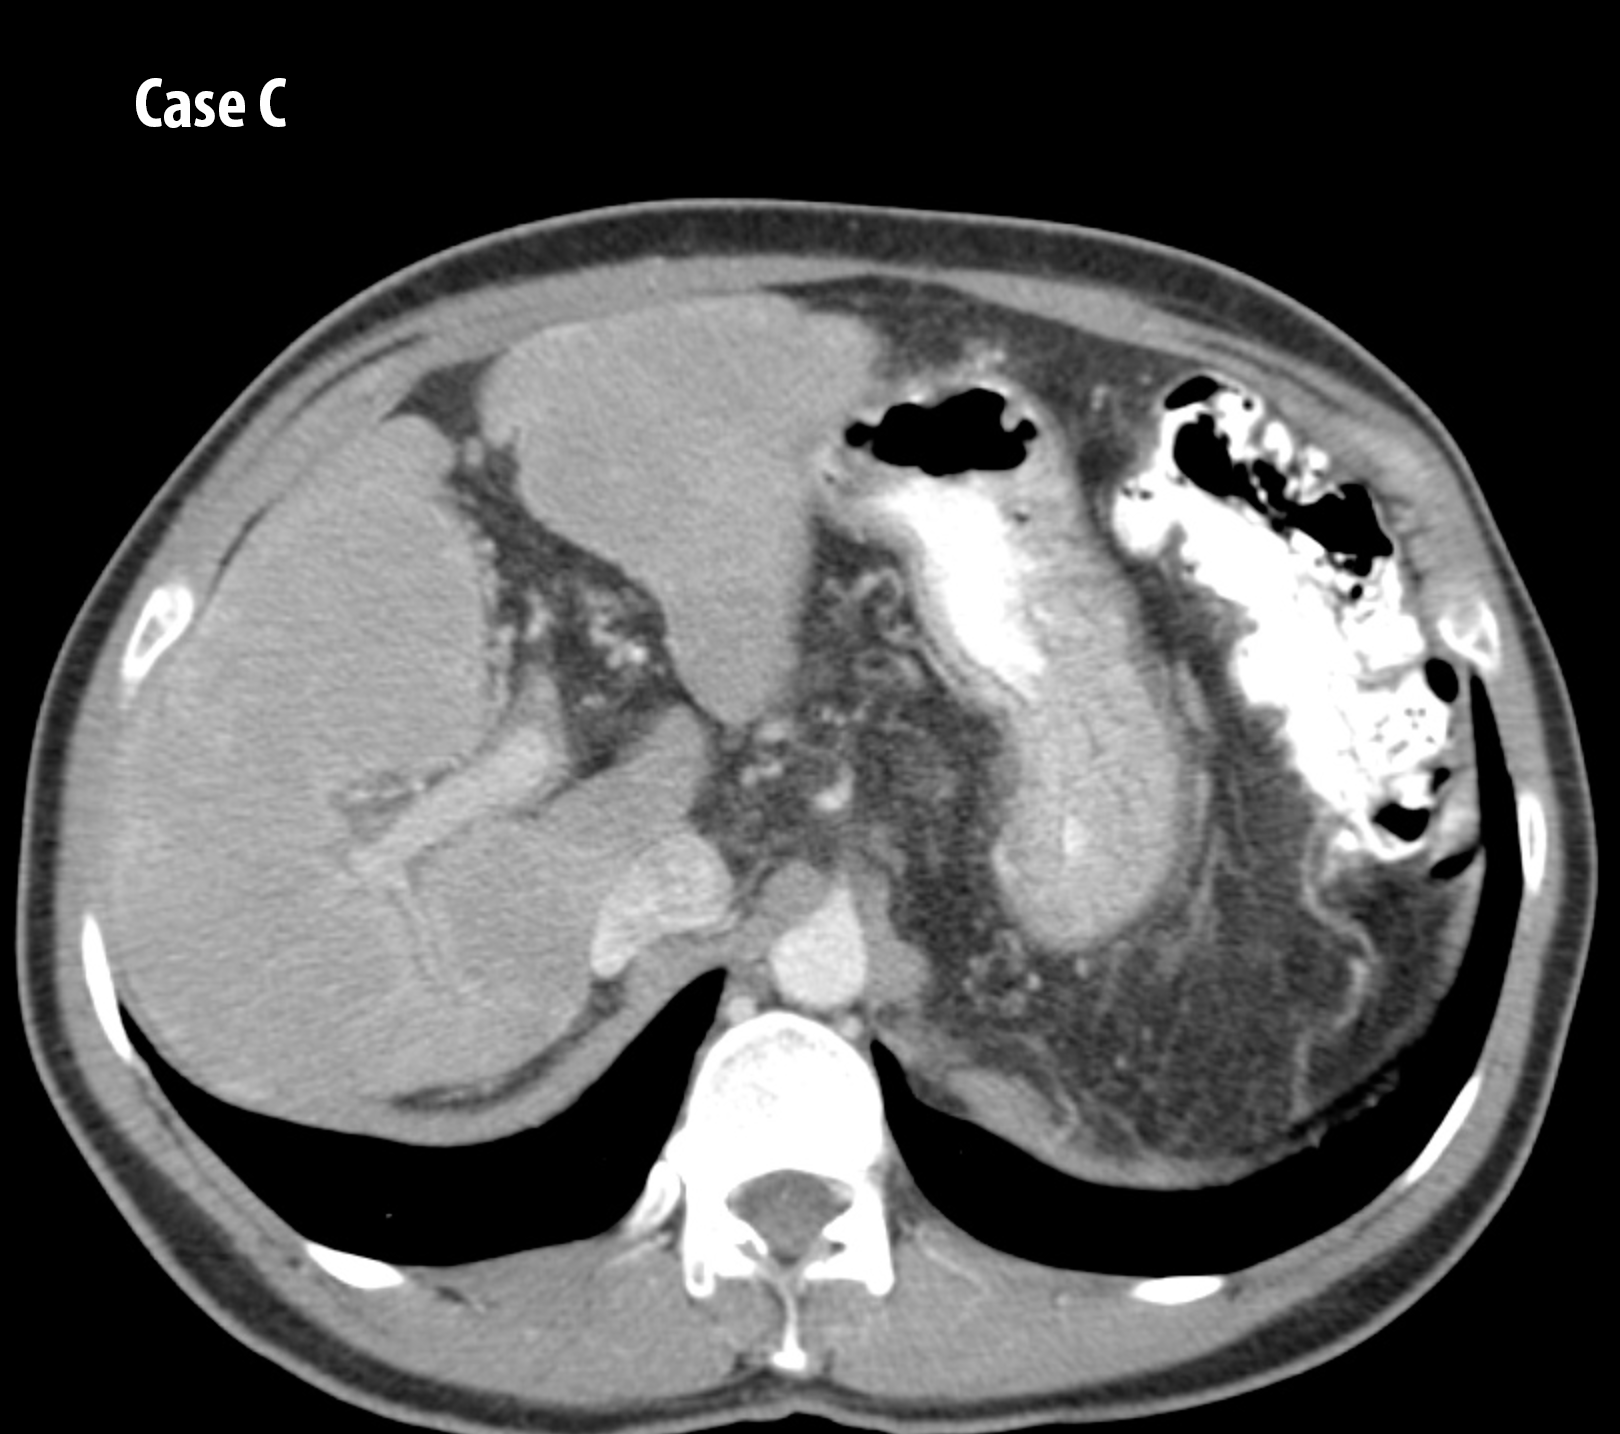
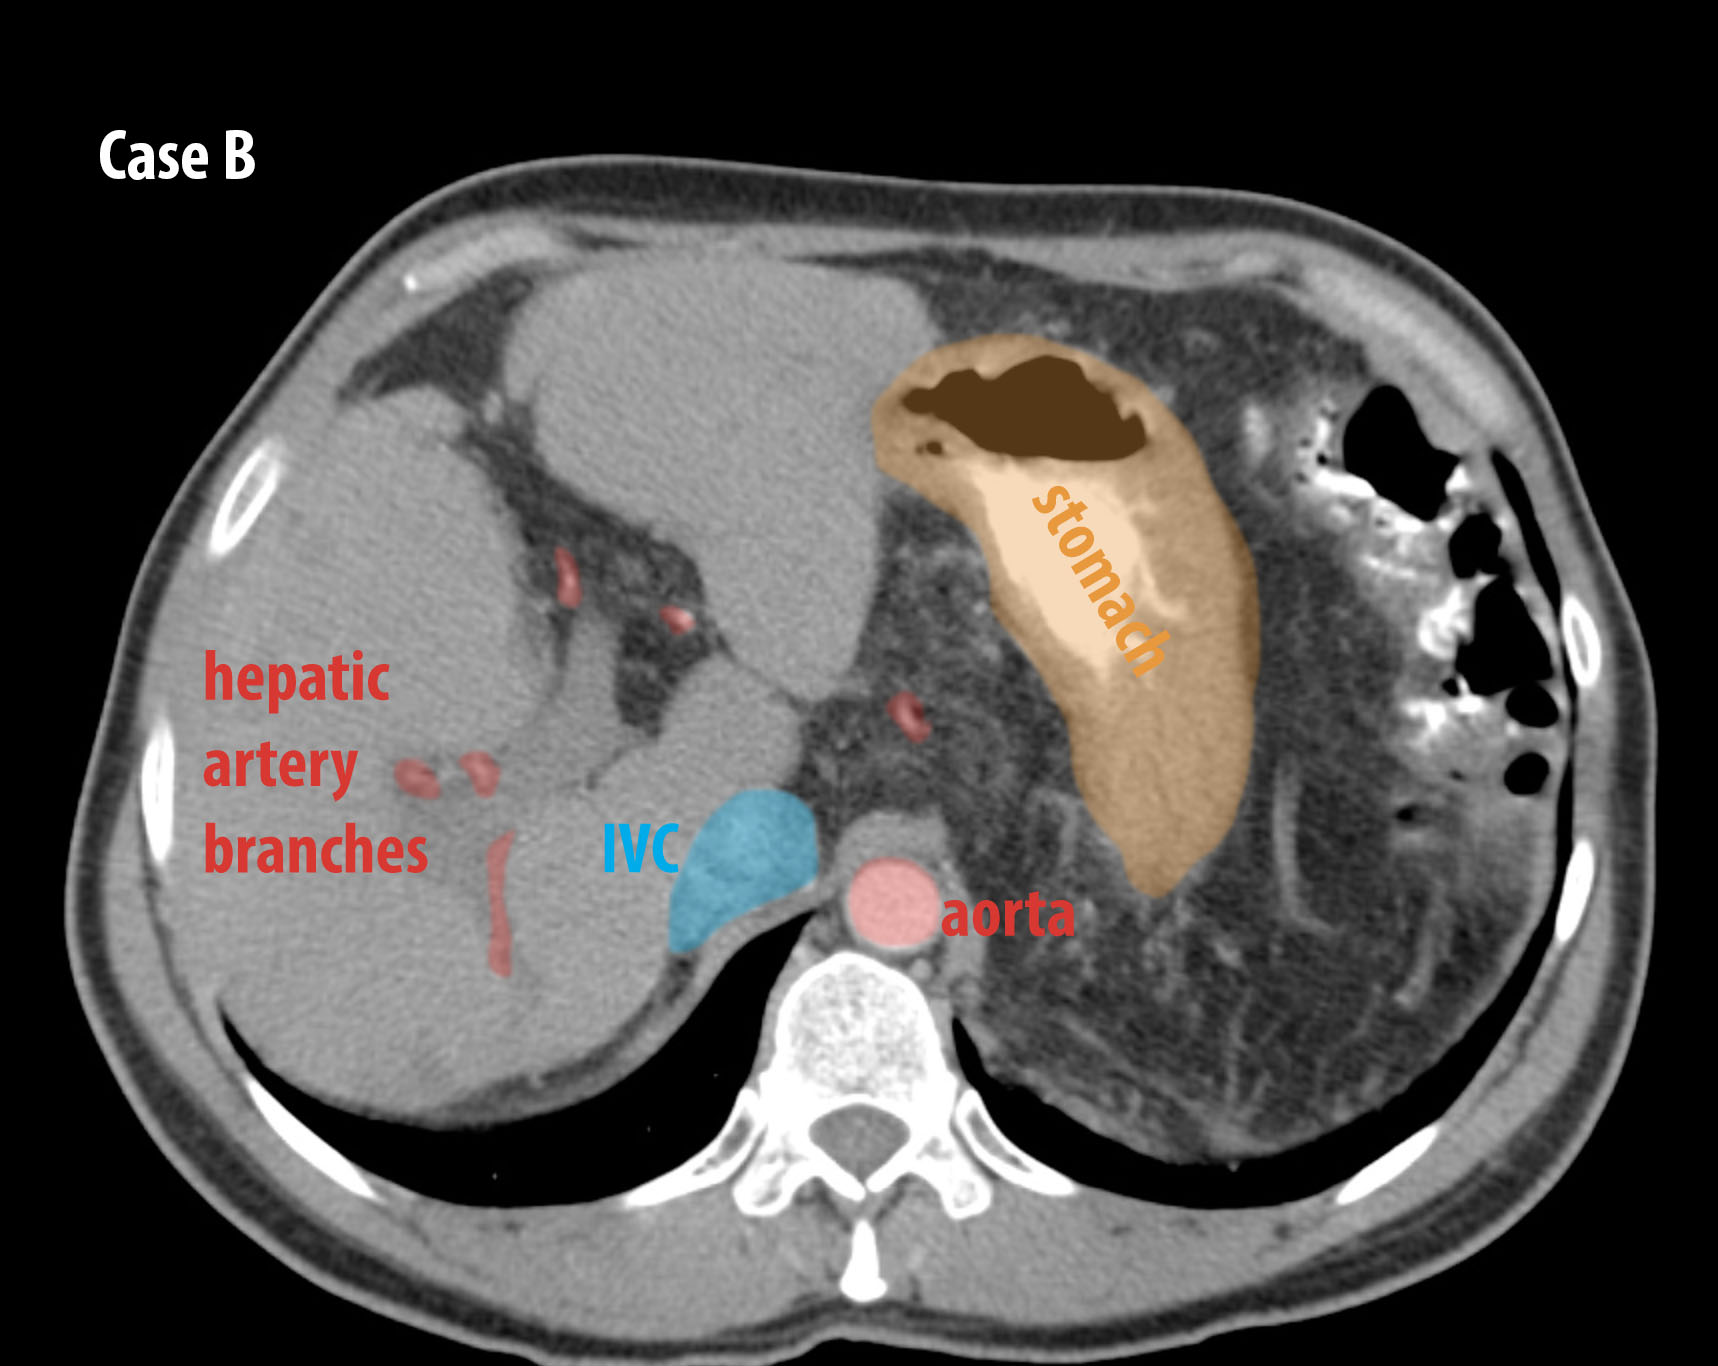
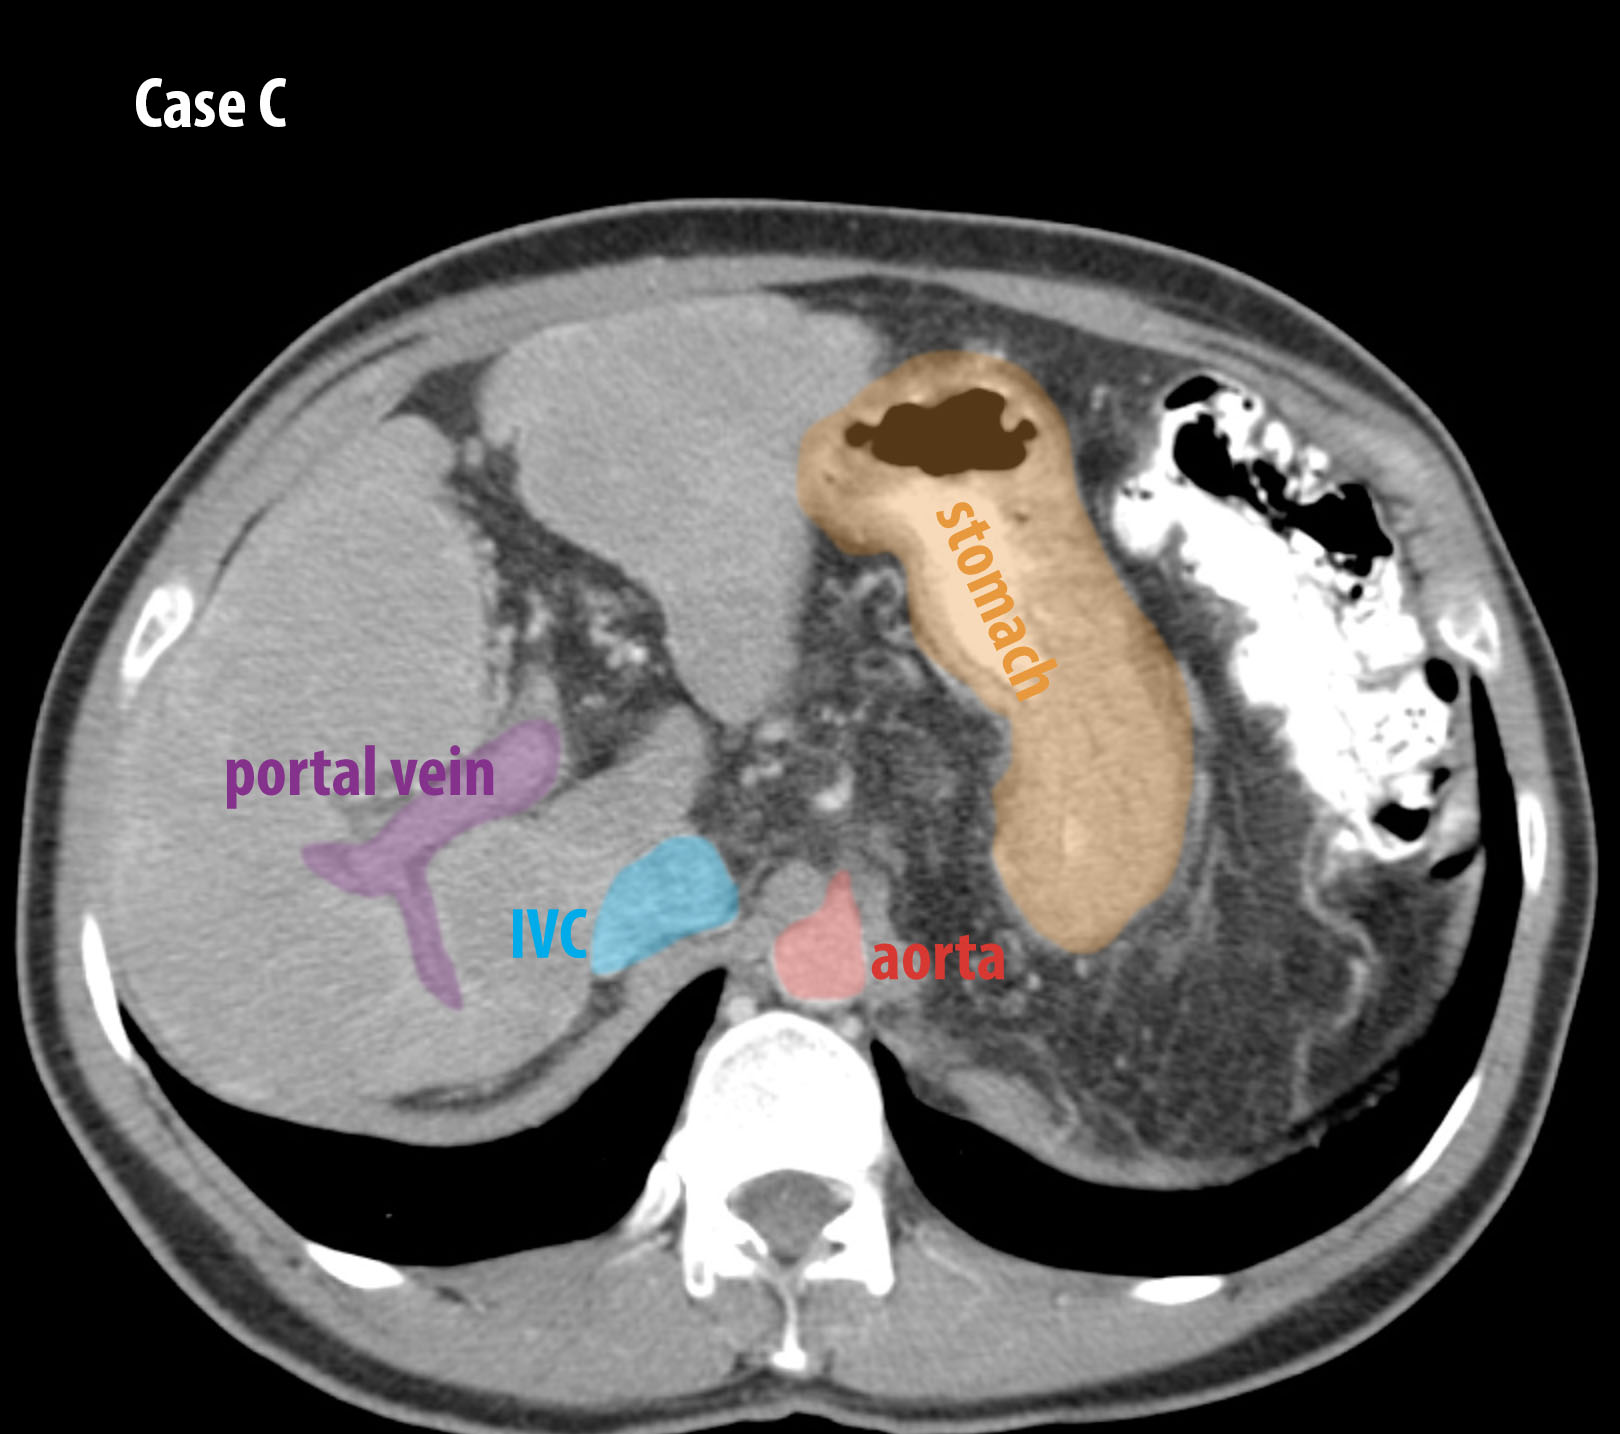
c) Decide which of the three cases below (Cases A, B, and C) were scanned early, mid or late after IV contrast administration, focusing on the appearance of the liver, aorta and IVC.
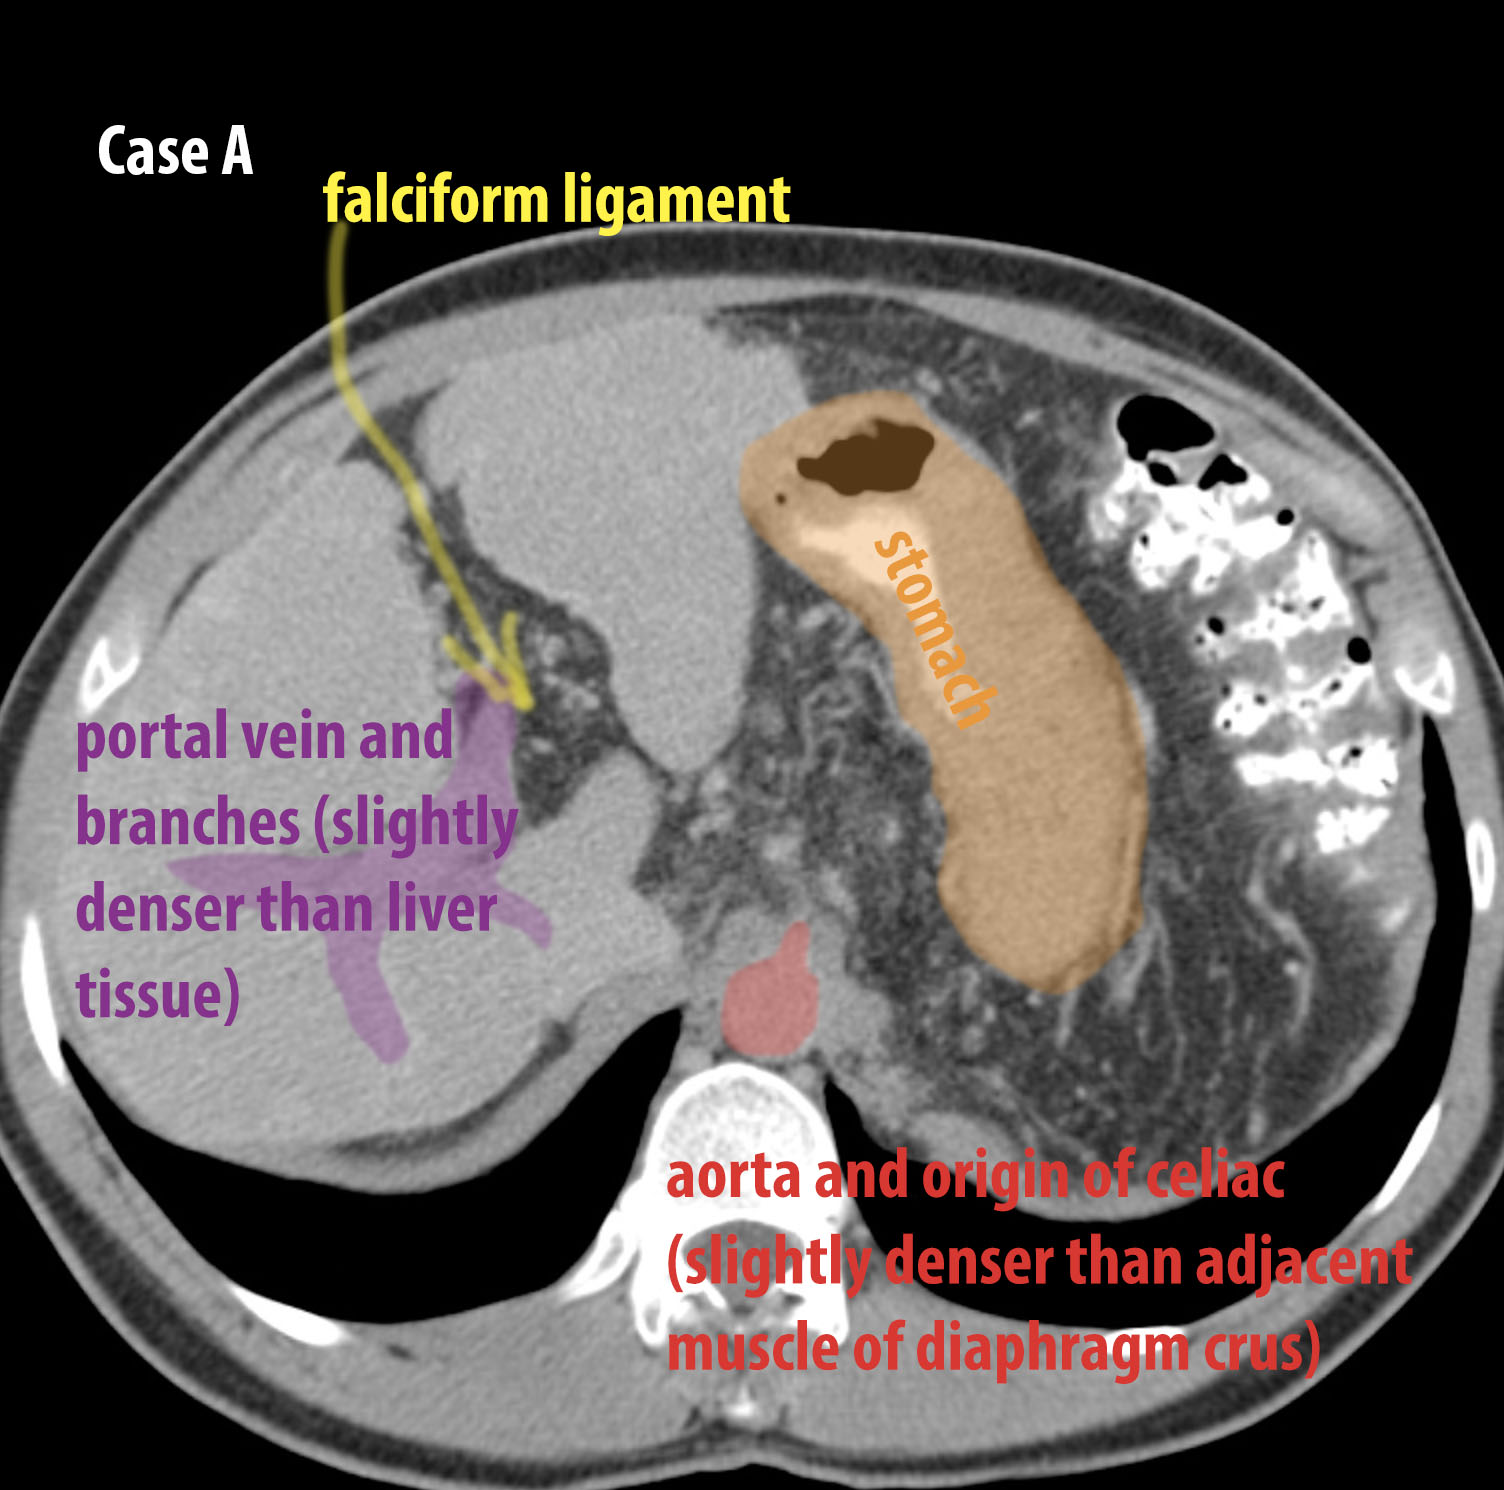
Case A shows only slight difference between the density of the liver tissue and the contained vessels. This was a delayed scan after contrast administration, where the contrast has equilibrated throughout the body, so the apparent density is only slightly higher than muscle or liver (because of dilution as well as excretion by the kidneys). Case B shows bright contrast in the aorta, little contrast in the IVC, very bright but tiny vessels in the liver. This indicates very early scanning, when the contrast is almost entirely in branches of the hepatic artery. Case C shows scanning in between the other two studies, in the 'portal' phase. The contrast in the aorta and IVC is similar in density and the larger vessels in the liver are now bright, consistent with contrast in the portal system.
steps for cross-sections:
1. what is it? 2. what imaging plane?
3. for CT, contrast/window? 4. where are we?
Imaging Anatomy Abdomen Case 1
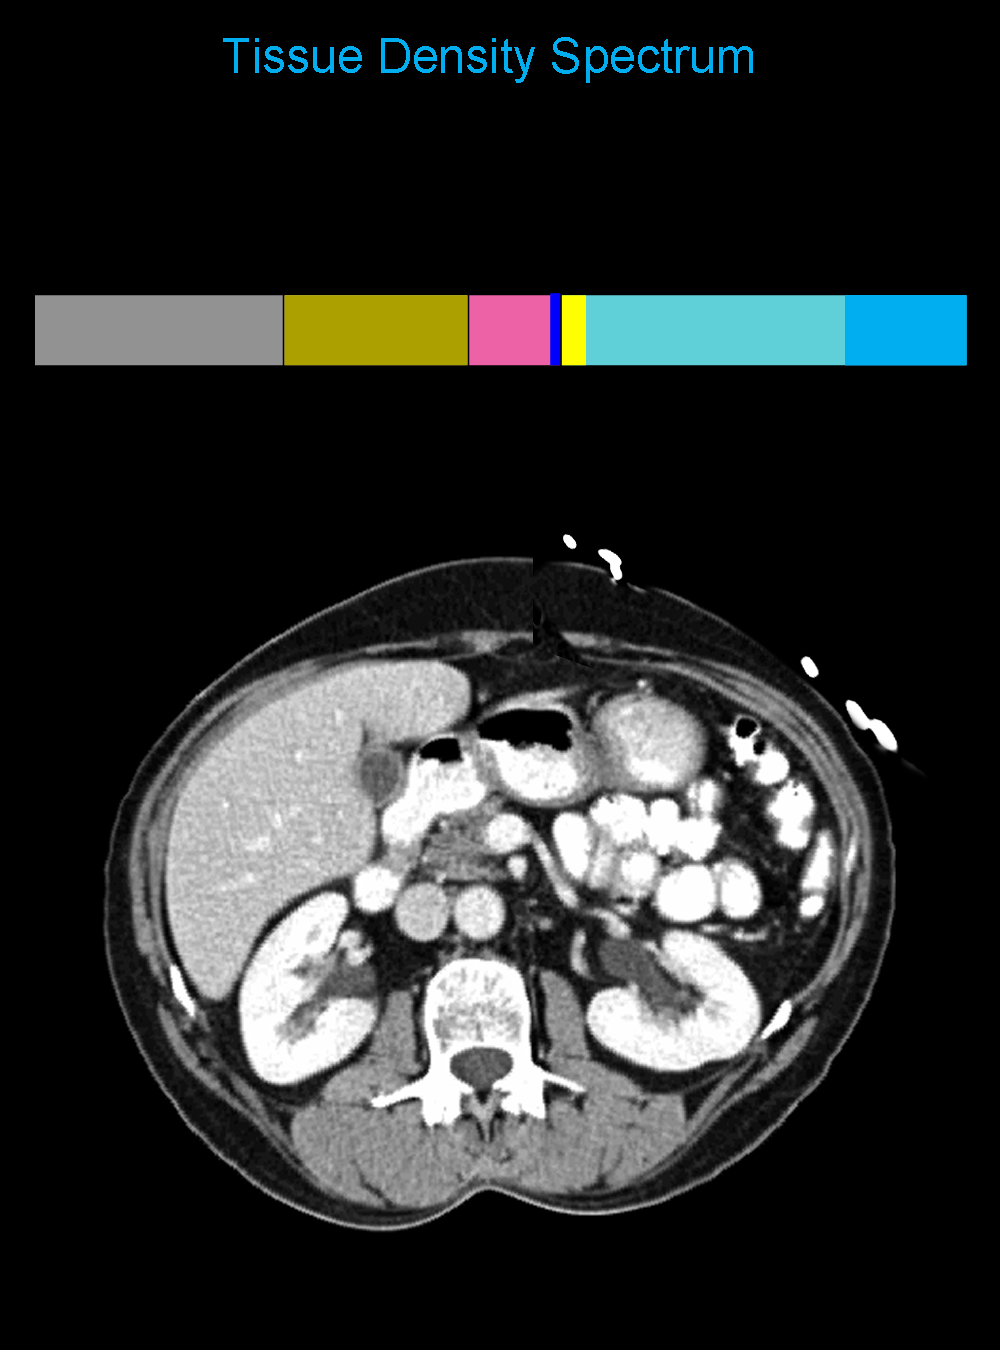
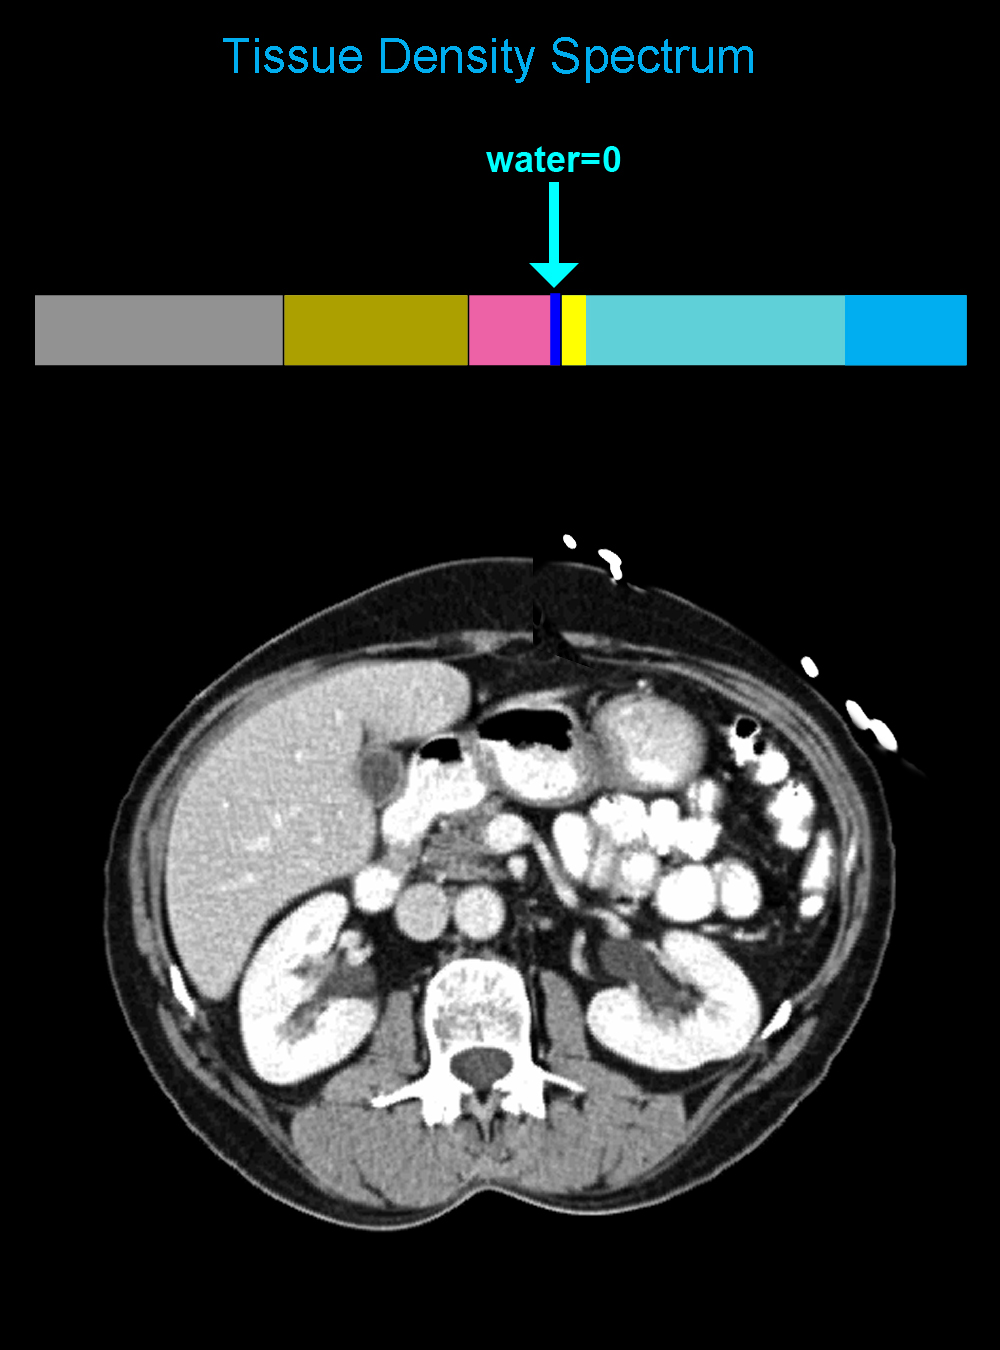
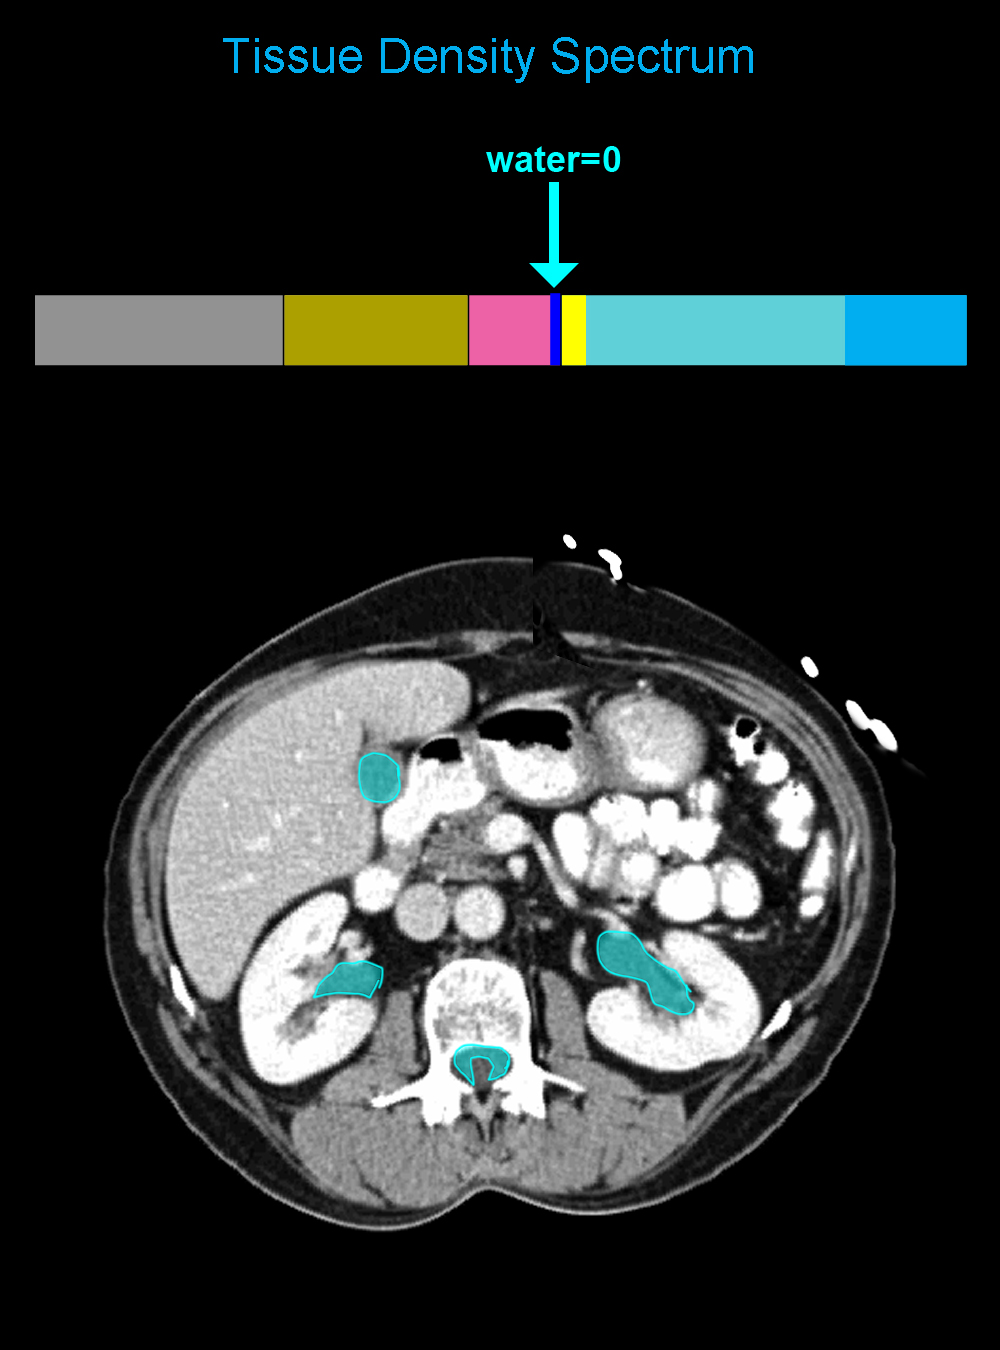
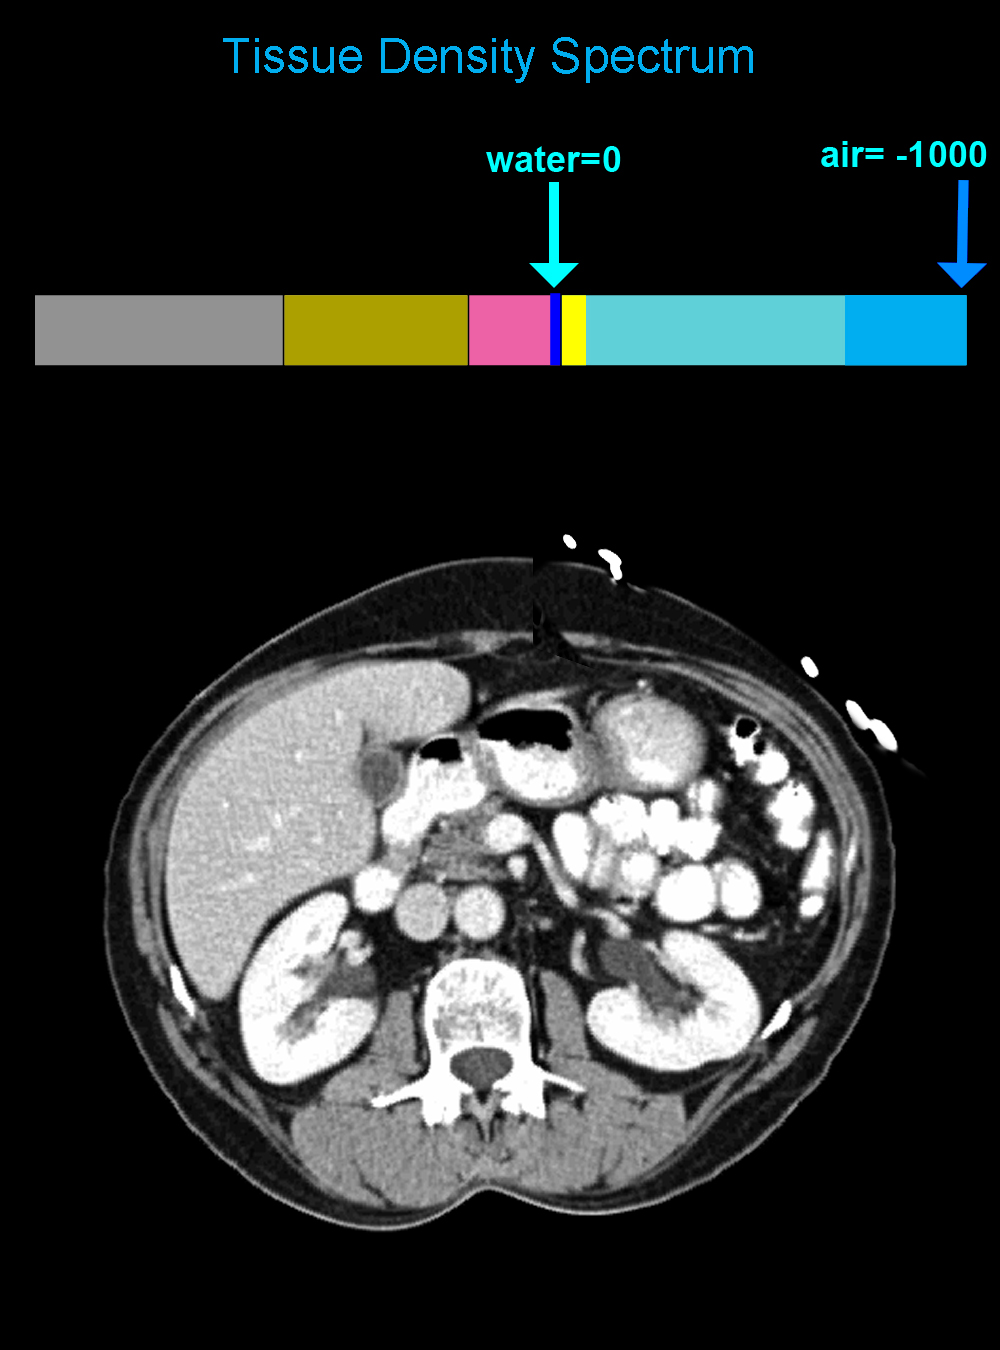
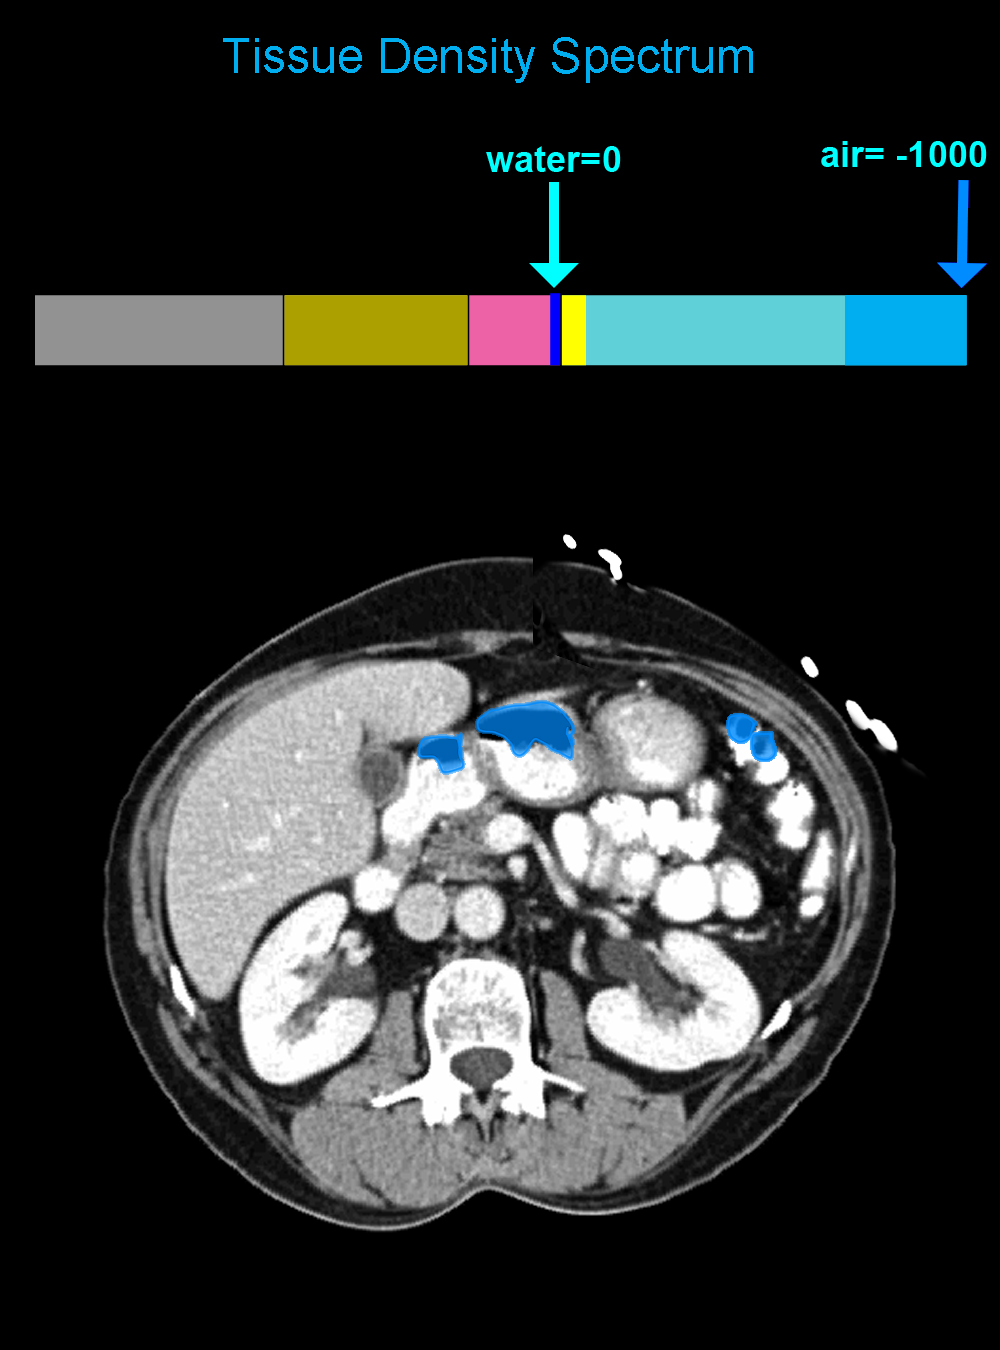
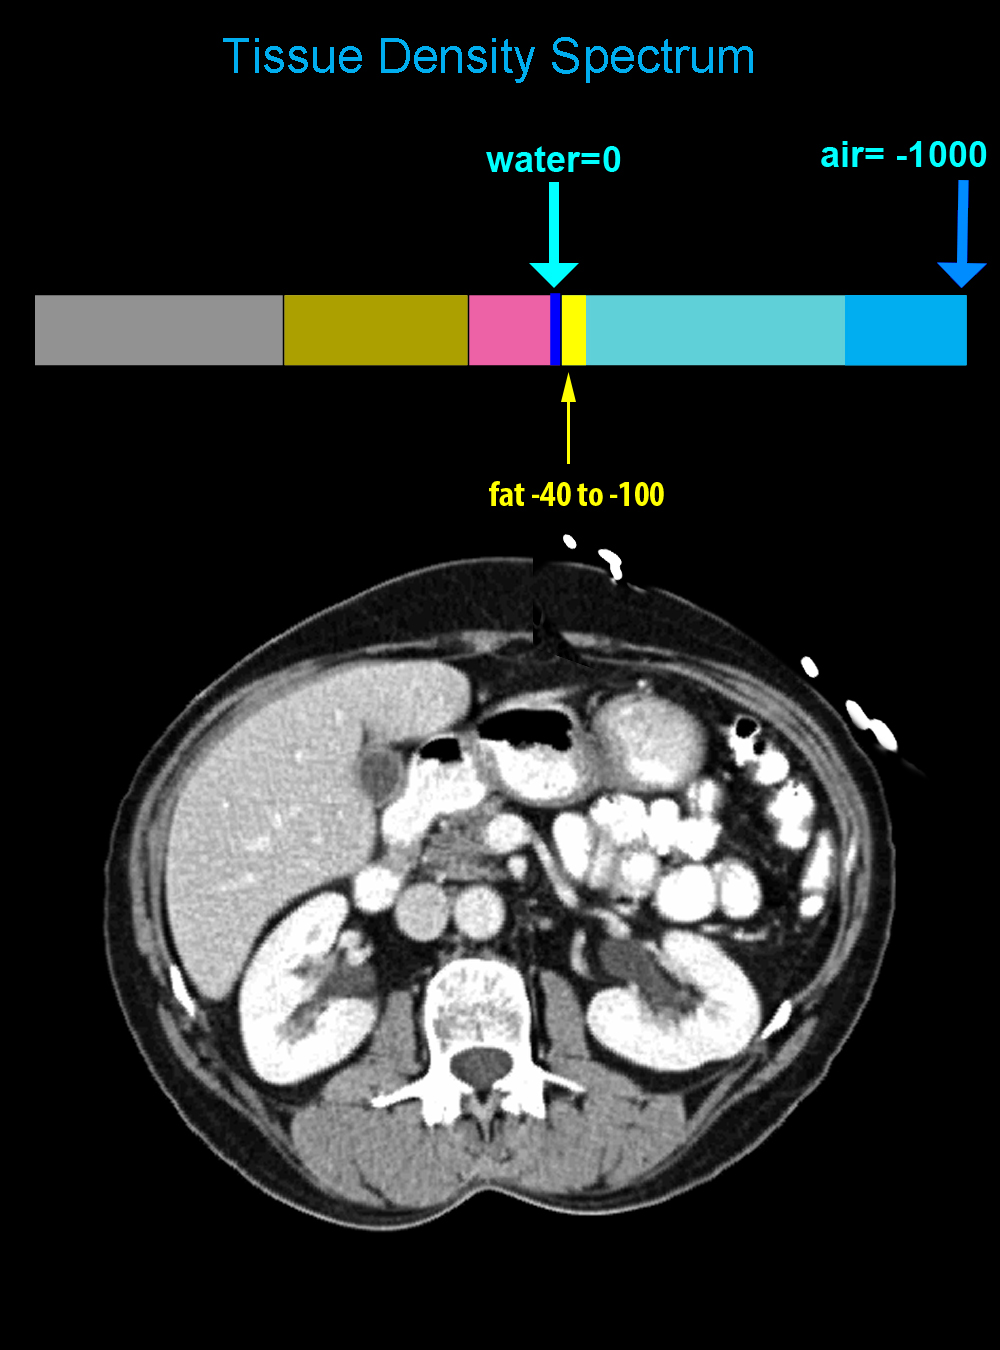
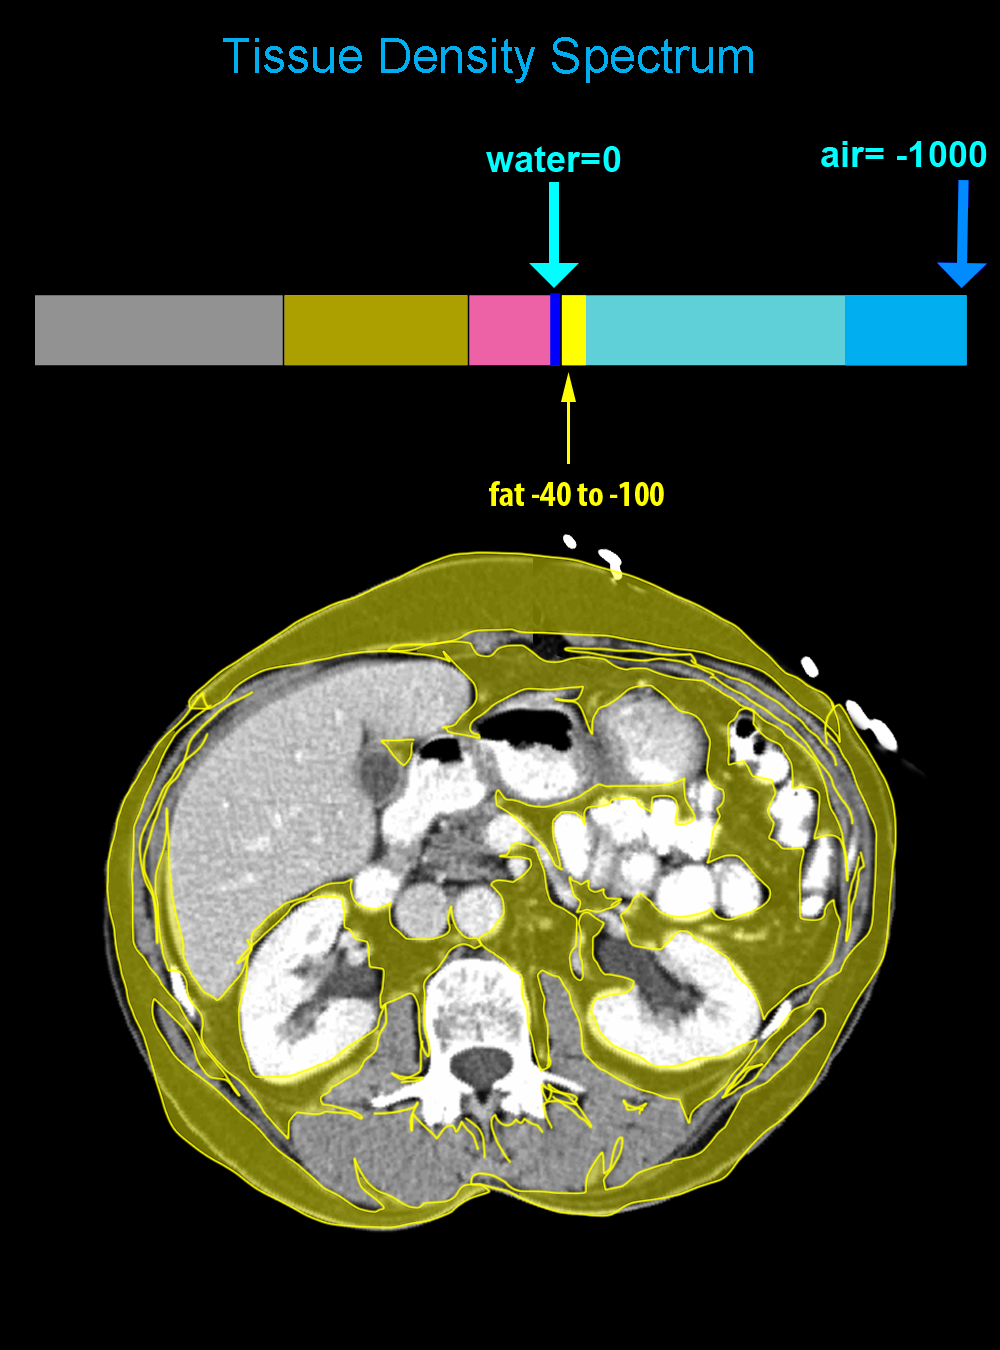
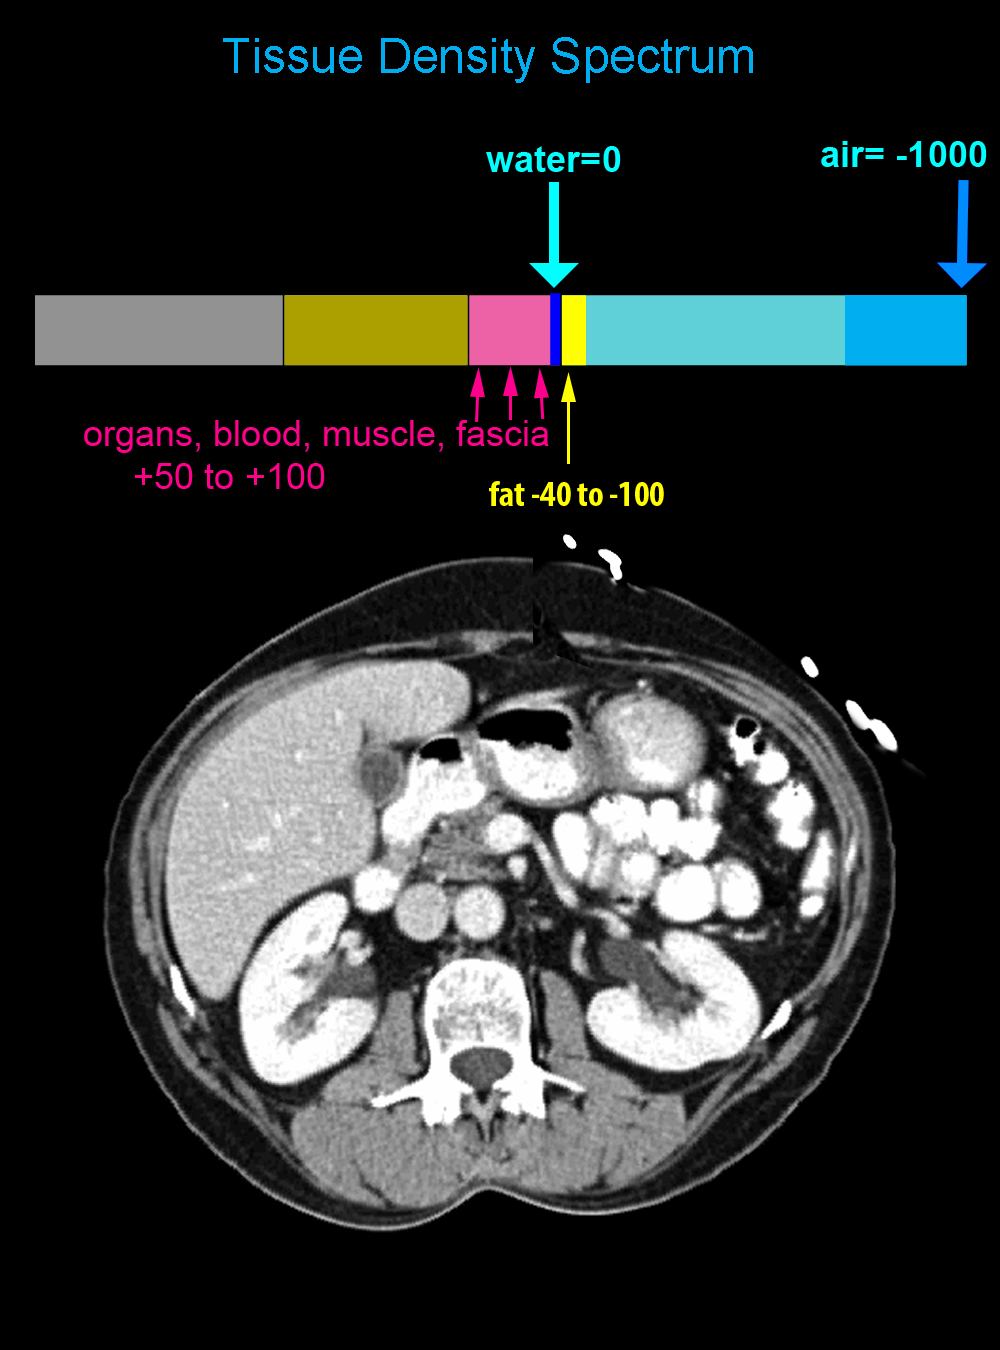
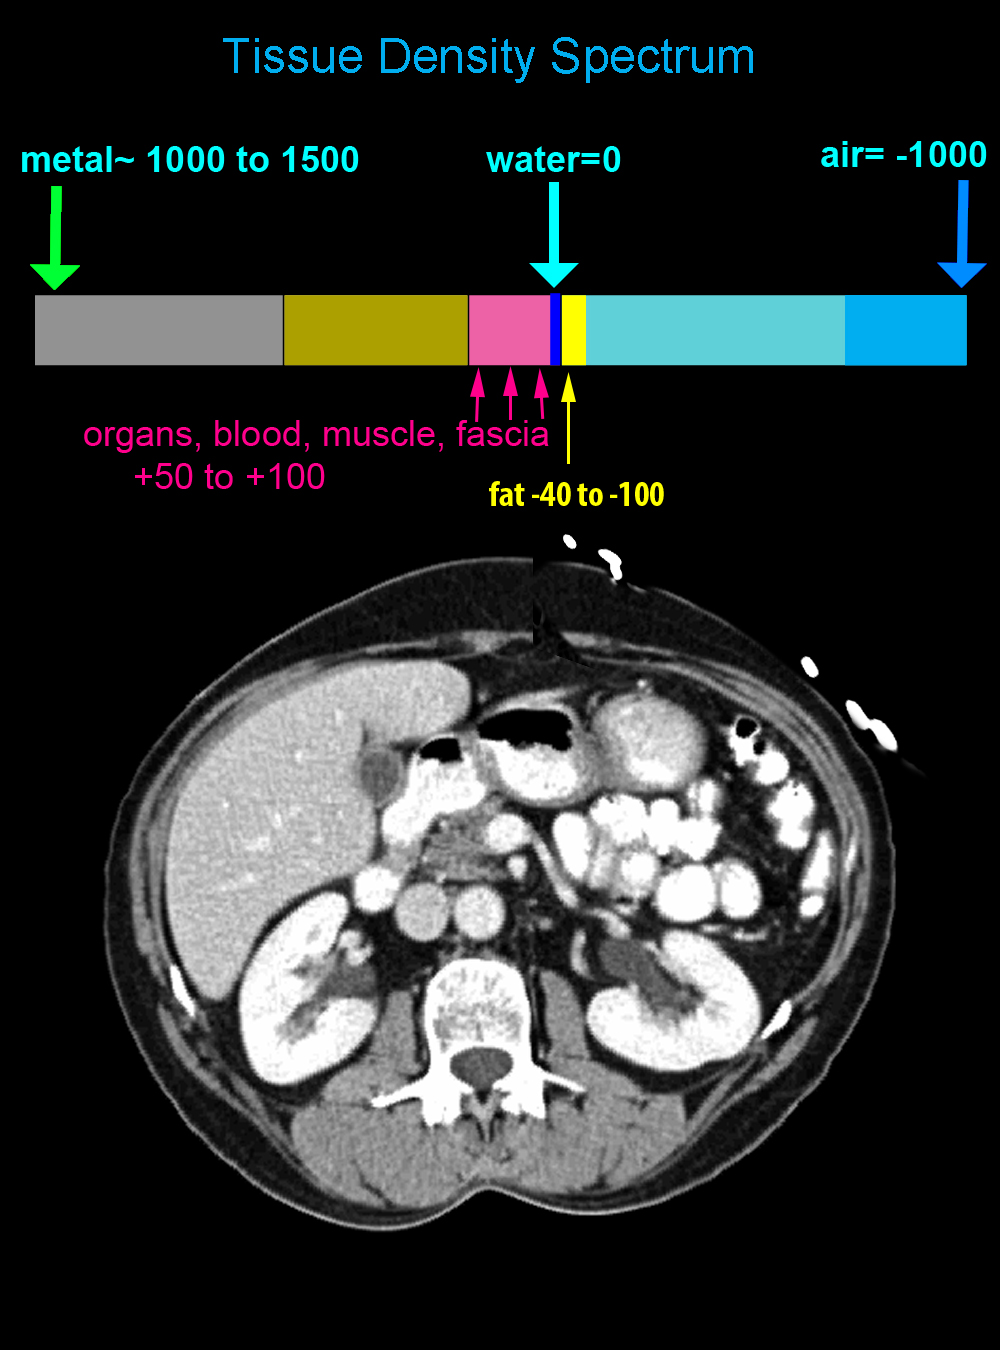
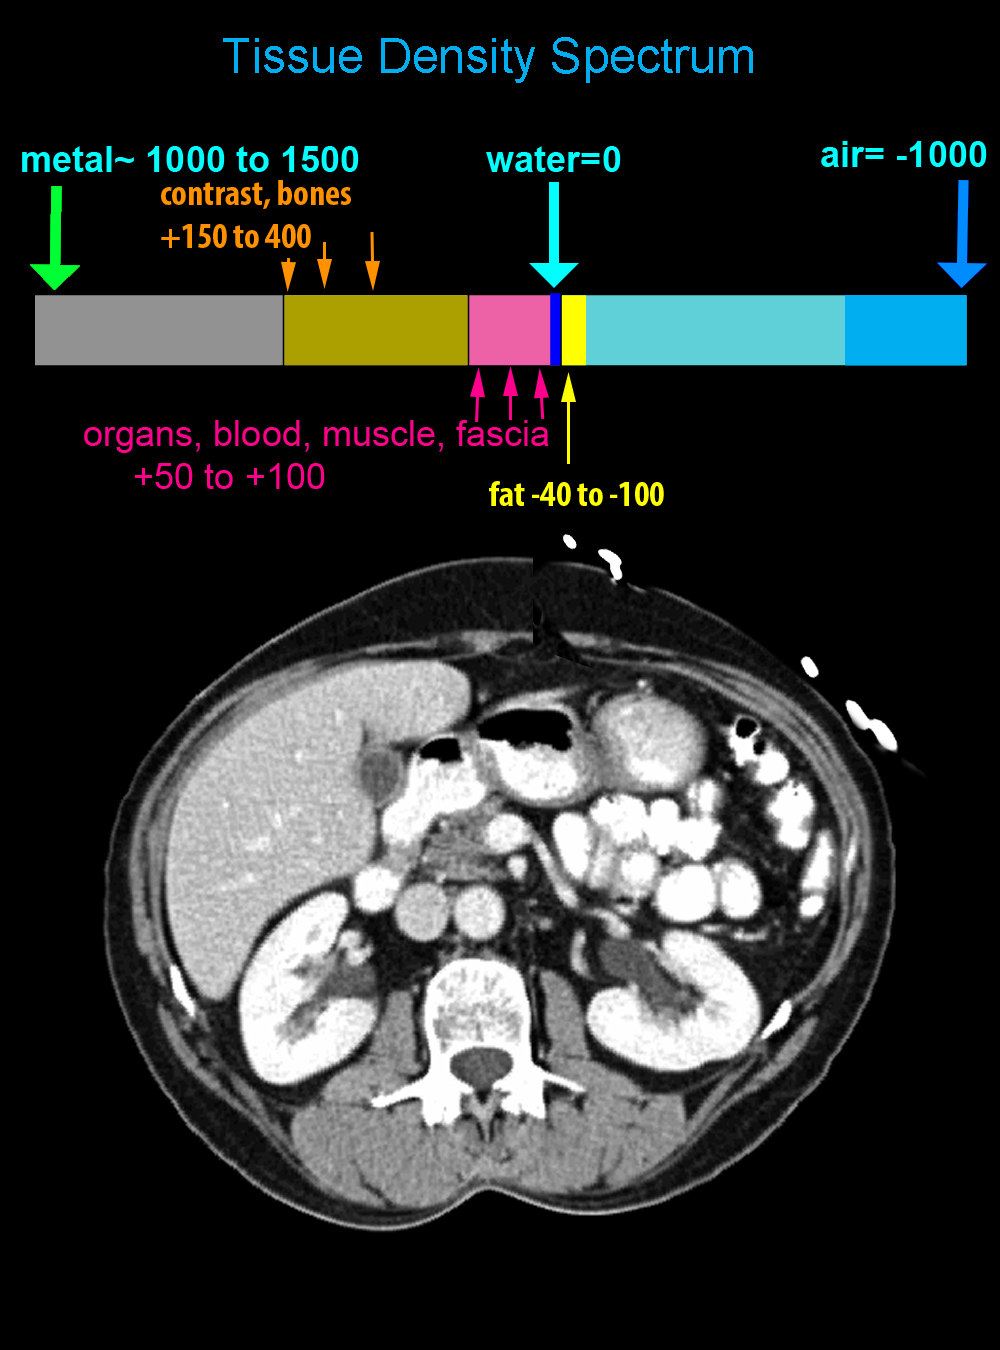
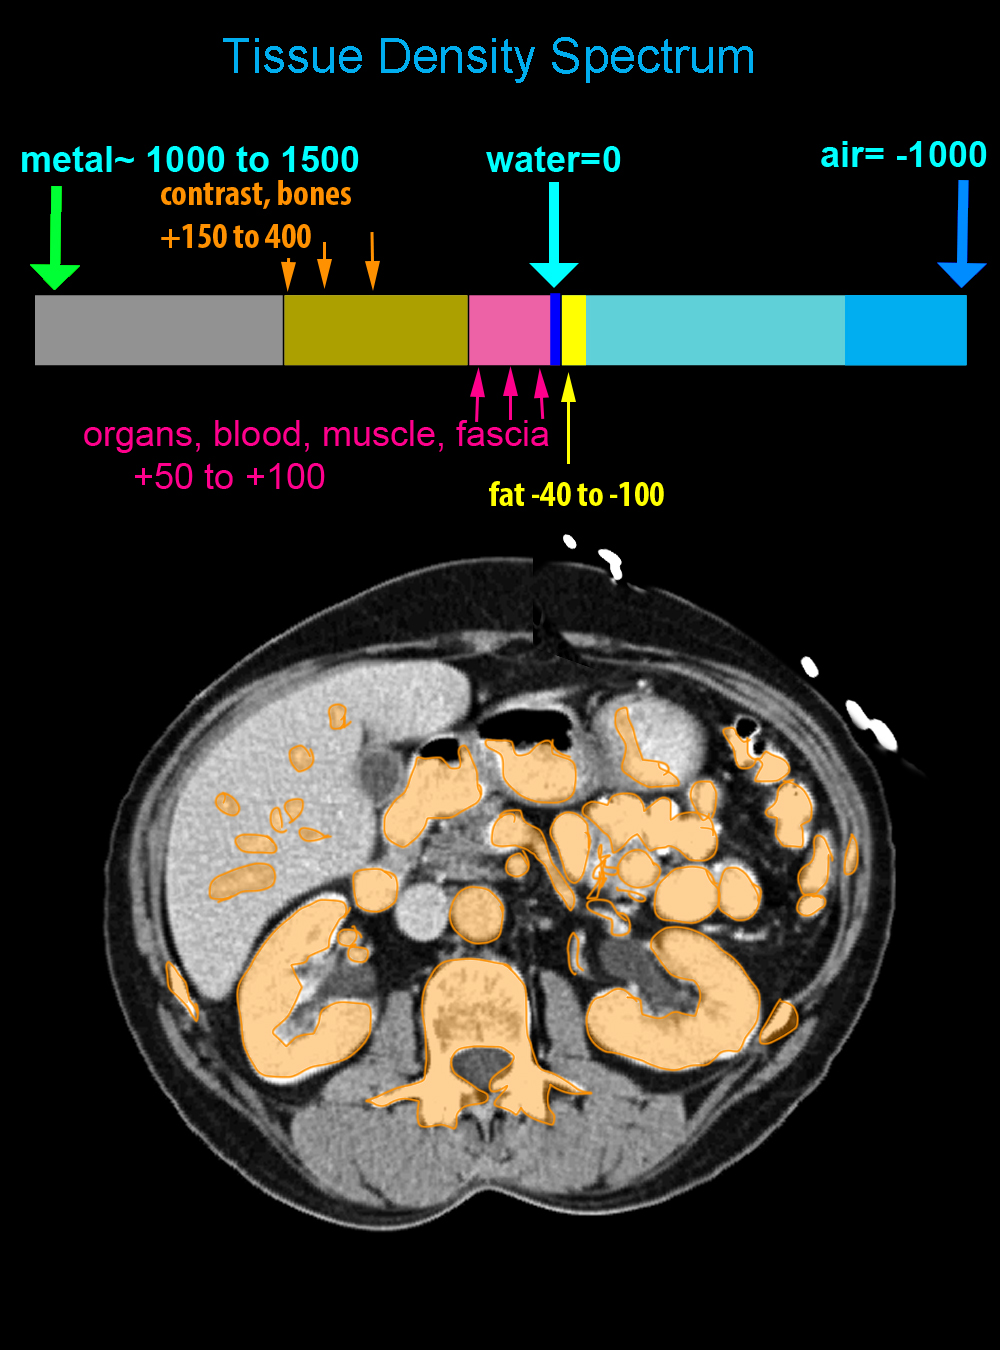
This is a single image from the original patient's axial CT, which is normal. On the tissue density spectrum shown below, the numeric scale that is used is the Hounsfield unit scale, named for Godfrey Hounsfield who helped develop CT.
Question 3:
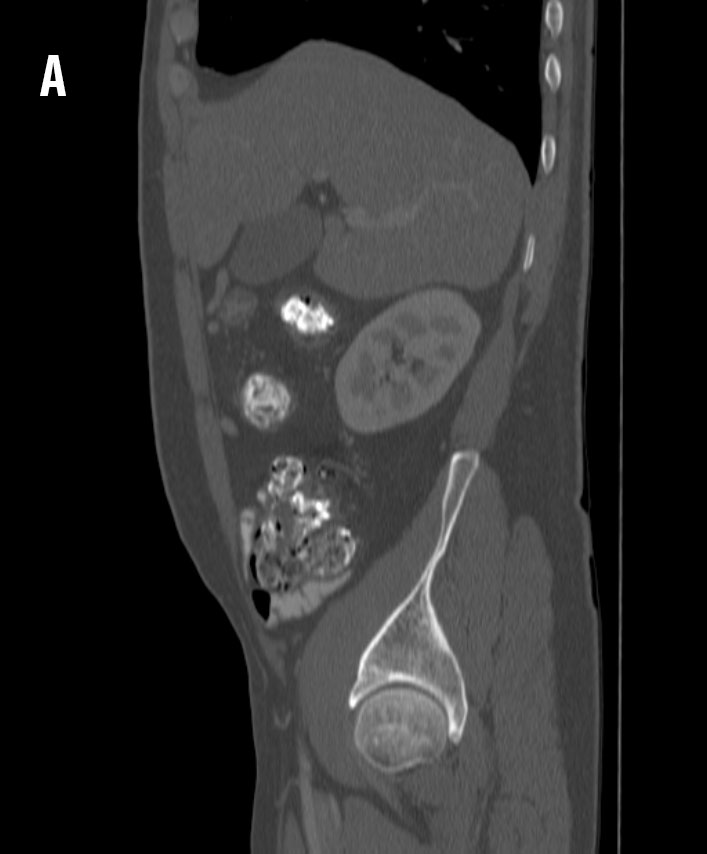
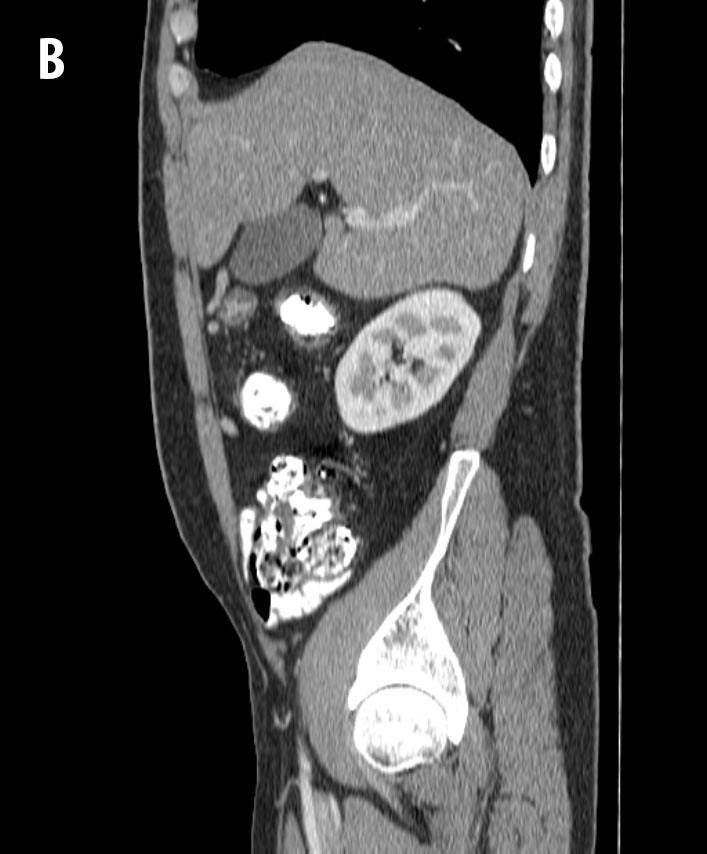
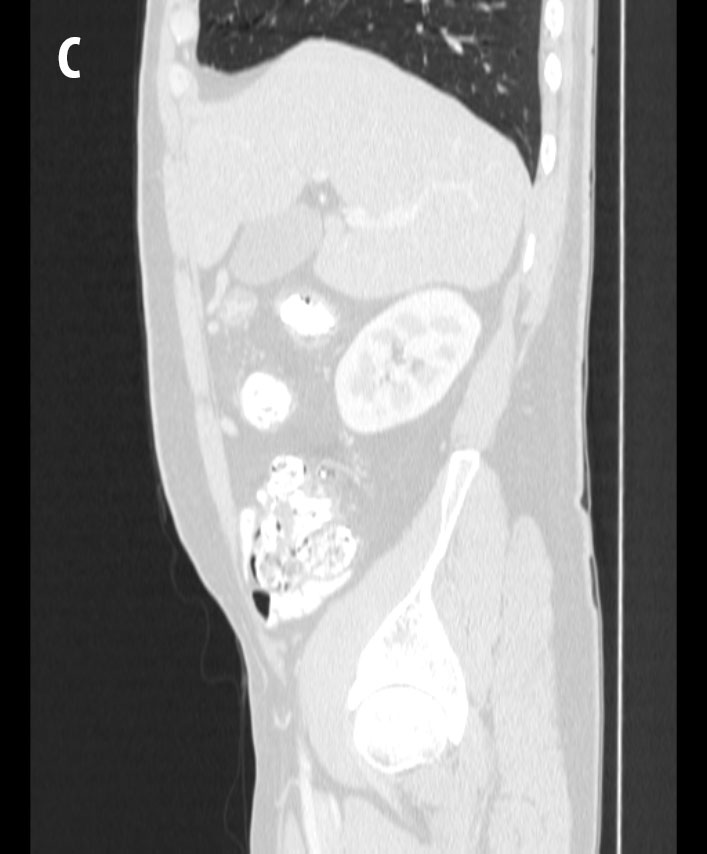
a) For each tissue indicated below, decide where it would be located along the density spectrum, then try to identify where the listed tissue is located on the CT image. Finally, identify the CT windows shown below.
Window A-bone window, meaning all of the shades of grey are clustered at the dense end of the spectrum Window B-soft tissue window, with shades of grey clustered in the center of the spectrum Window C-lung window, with shades of grey at the air end of the spectrum
b) Are there other types of CT windows besides bone, lung and soft tissue?
There are many other specialized windows that can be used for viewing CT data, including special ones for the brain, the brainstem, the liver, and for visualizing IV contrast. However the most common ones that are used are bone, lung and soft tissue.
steps for cross-sections:
1. what is it? 2. what imaging plane?
3. for CT, contrast/window? 4. where are we?
