

Question 1:
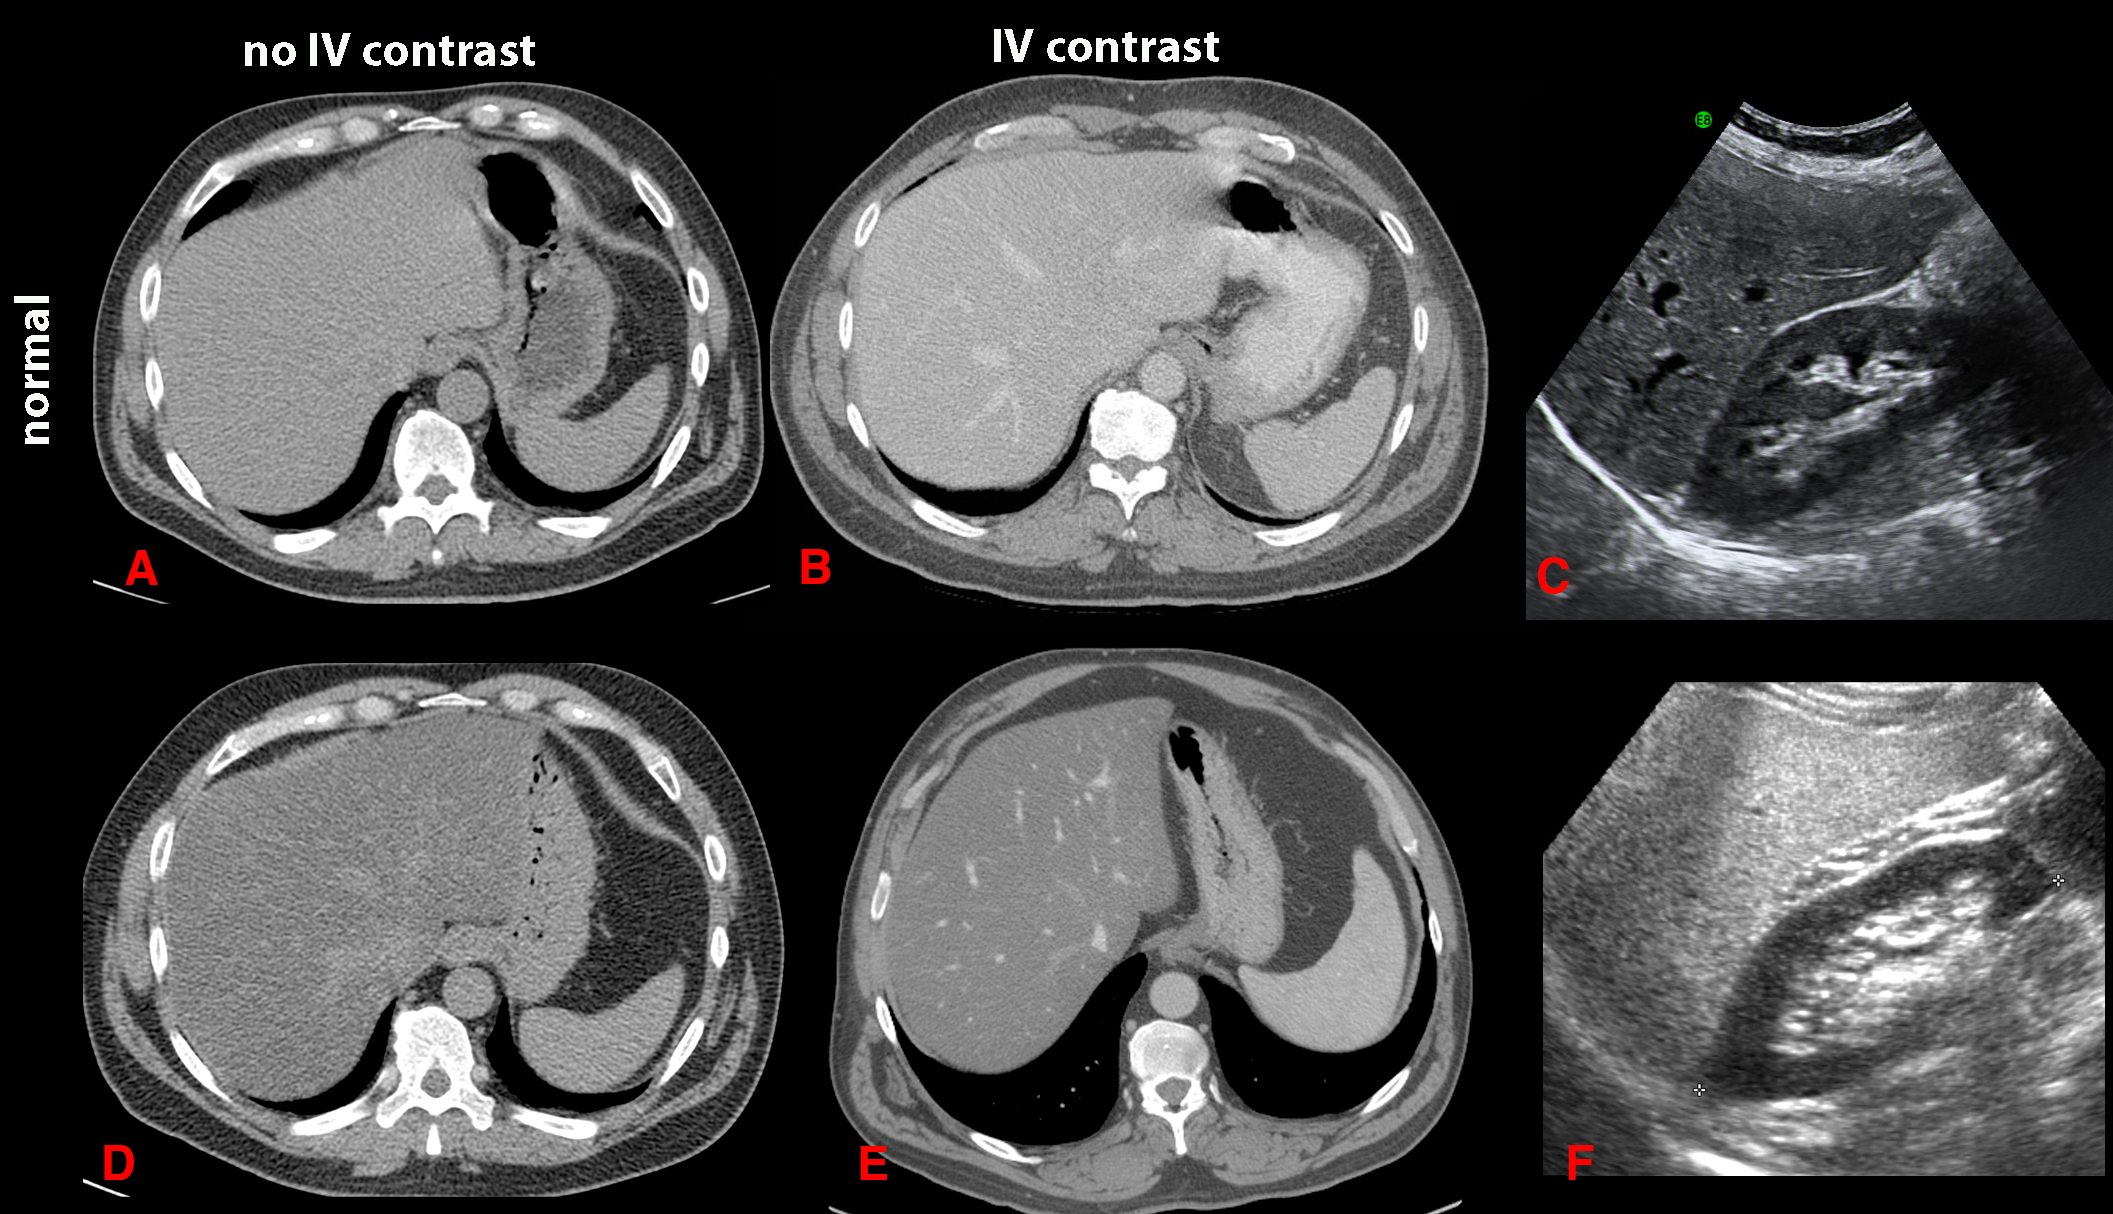
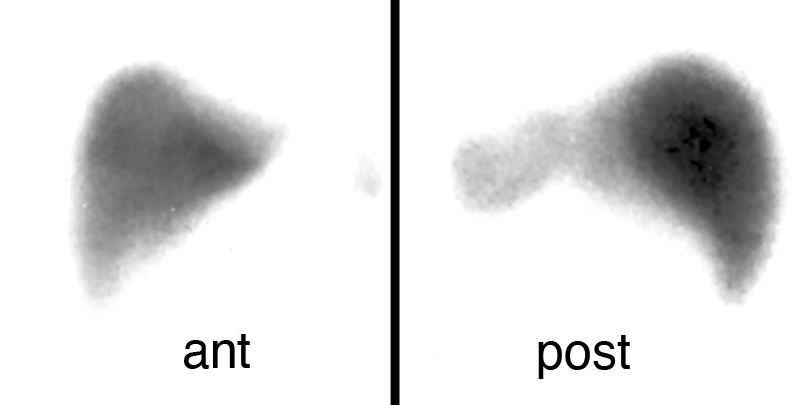
You are shown three normal studies on the top row of images, and three abnormal studies on the bottom row of images. What is each study? What problem in the liver is seen on the bottom images? What is the mystery study.
Images A, B, D, and E are all axial CT images. Images A and D have no IV contrast, and images B and E have IV contrast imaged in the portal phase. Images C and F are abdominal ultrasound images in the sagittal plane, showing liver and kidney. On Image D (compared to Image A), you can actually see the portal vessels in the liver, which appear denser than the liver parenchyma. This is not normal, and indicates that the liver parenchyma is abnormally low in density, consistent with fatty infiltration. On image E, the IV contrast has made portal vessels stand out even more brightly against the dark surrounding parenchyma than on the normal Image B. On the ultrasound, the liver parenchyma in Image F is much brighter than the adjacent kidney, while this difference is less on the normal Image C. Fat is generally echogenic (white) on ultrasound images. The mystery study is a normal liver-spleen scan, a nuclear medicine study that uses a tracer that is taken up by the reticuloendothelial system present in normal liver, spleen and bone marrow.
Question 2:
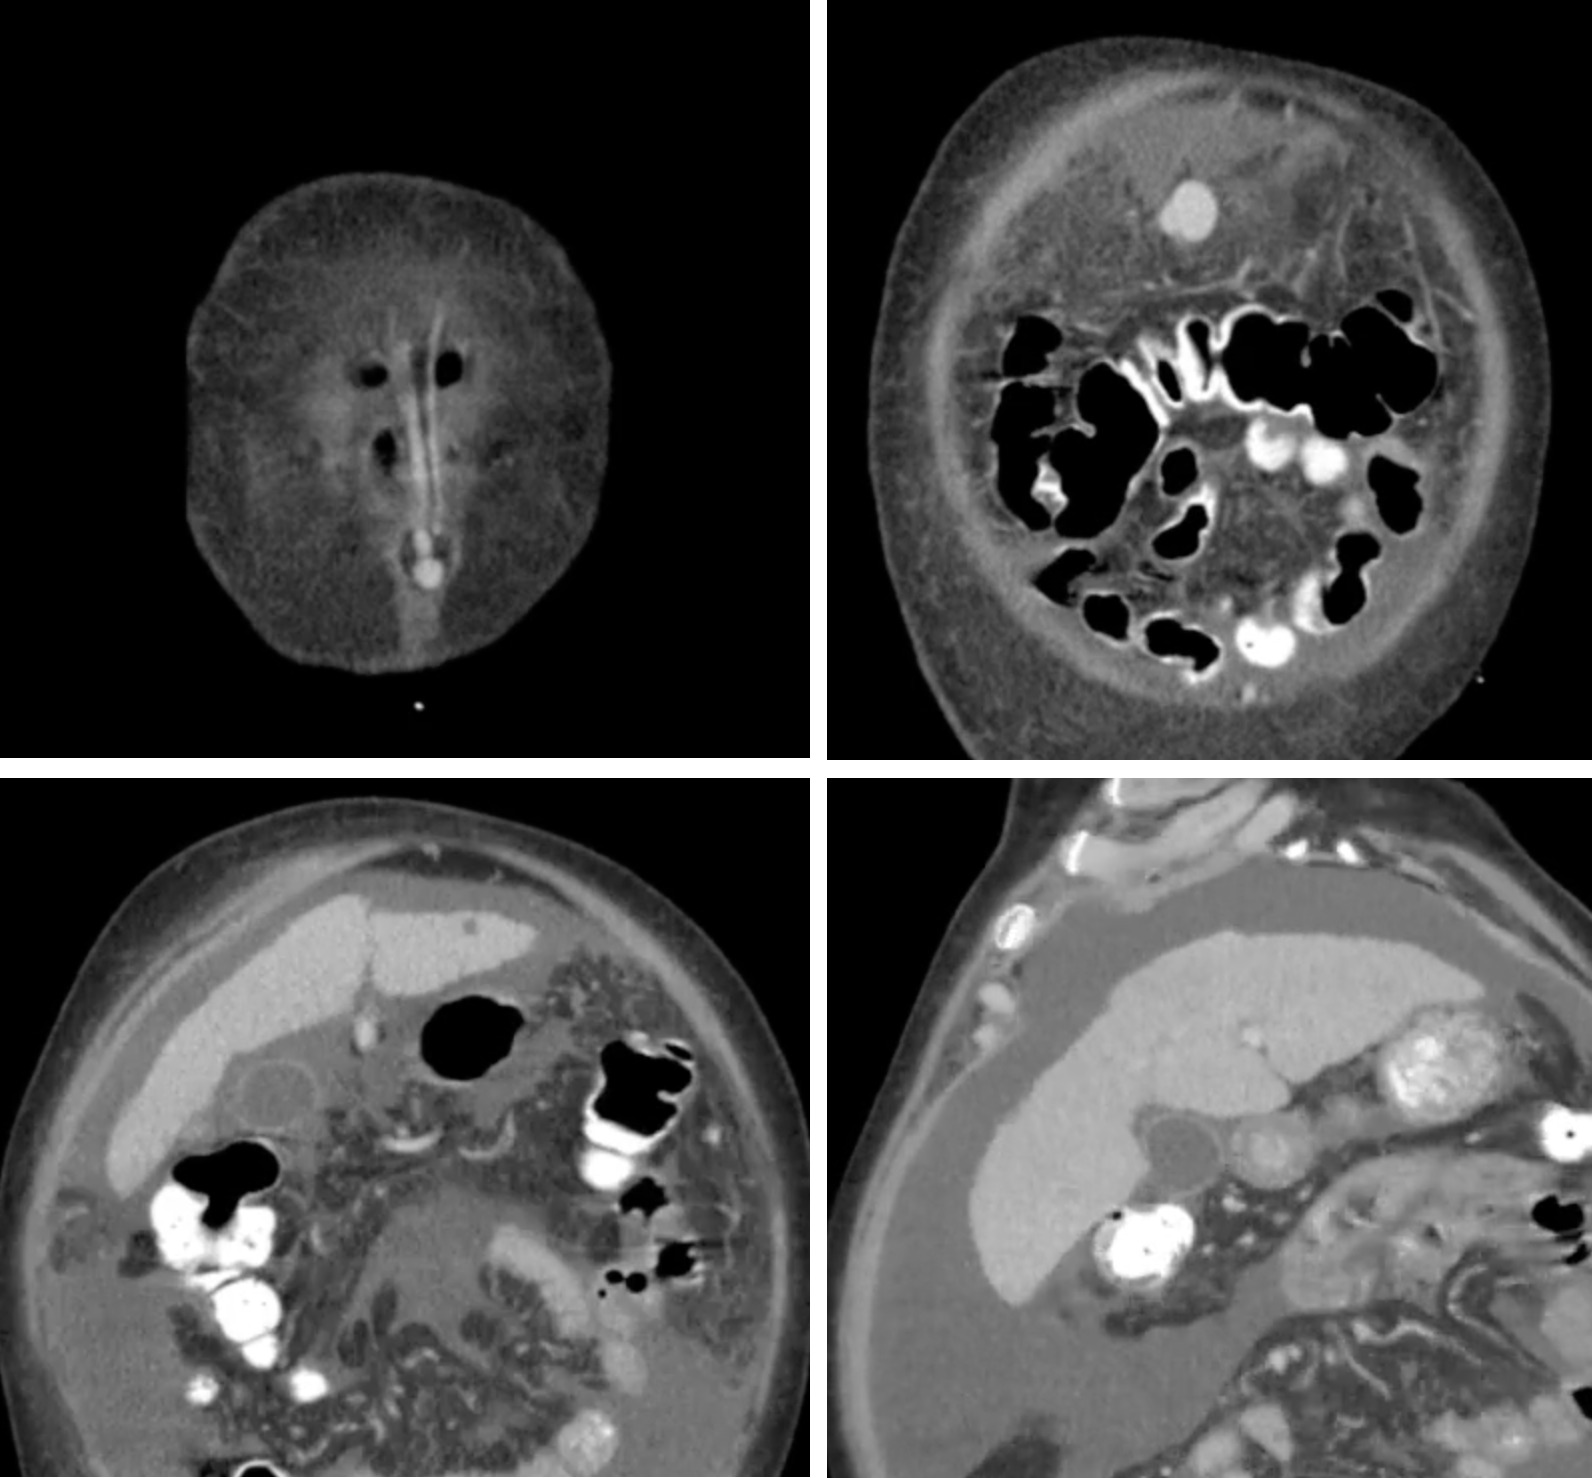
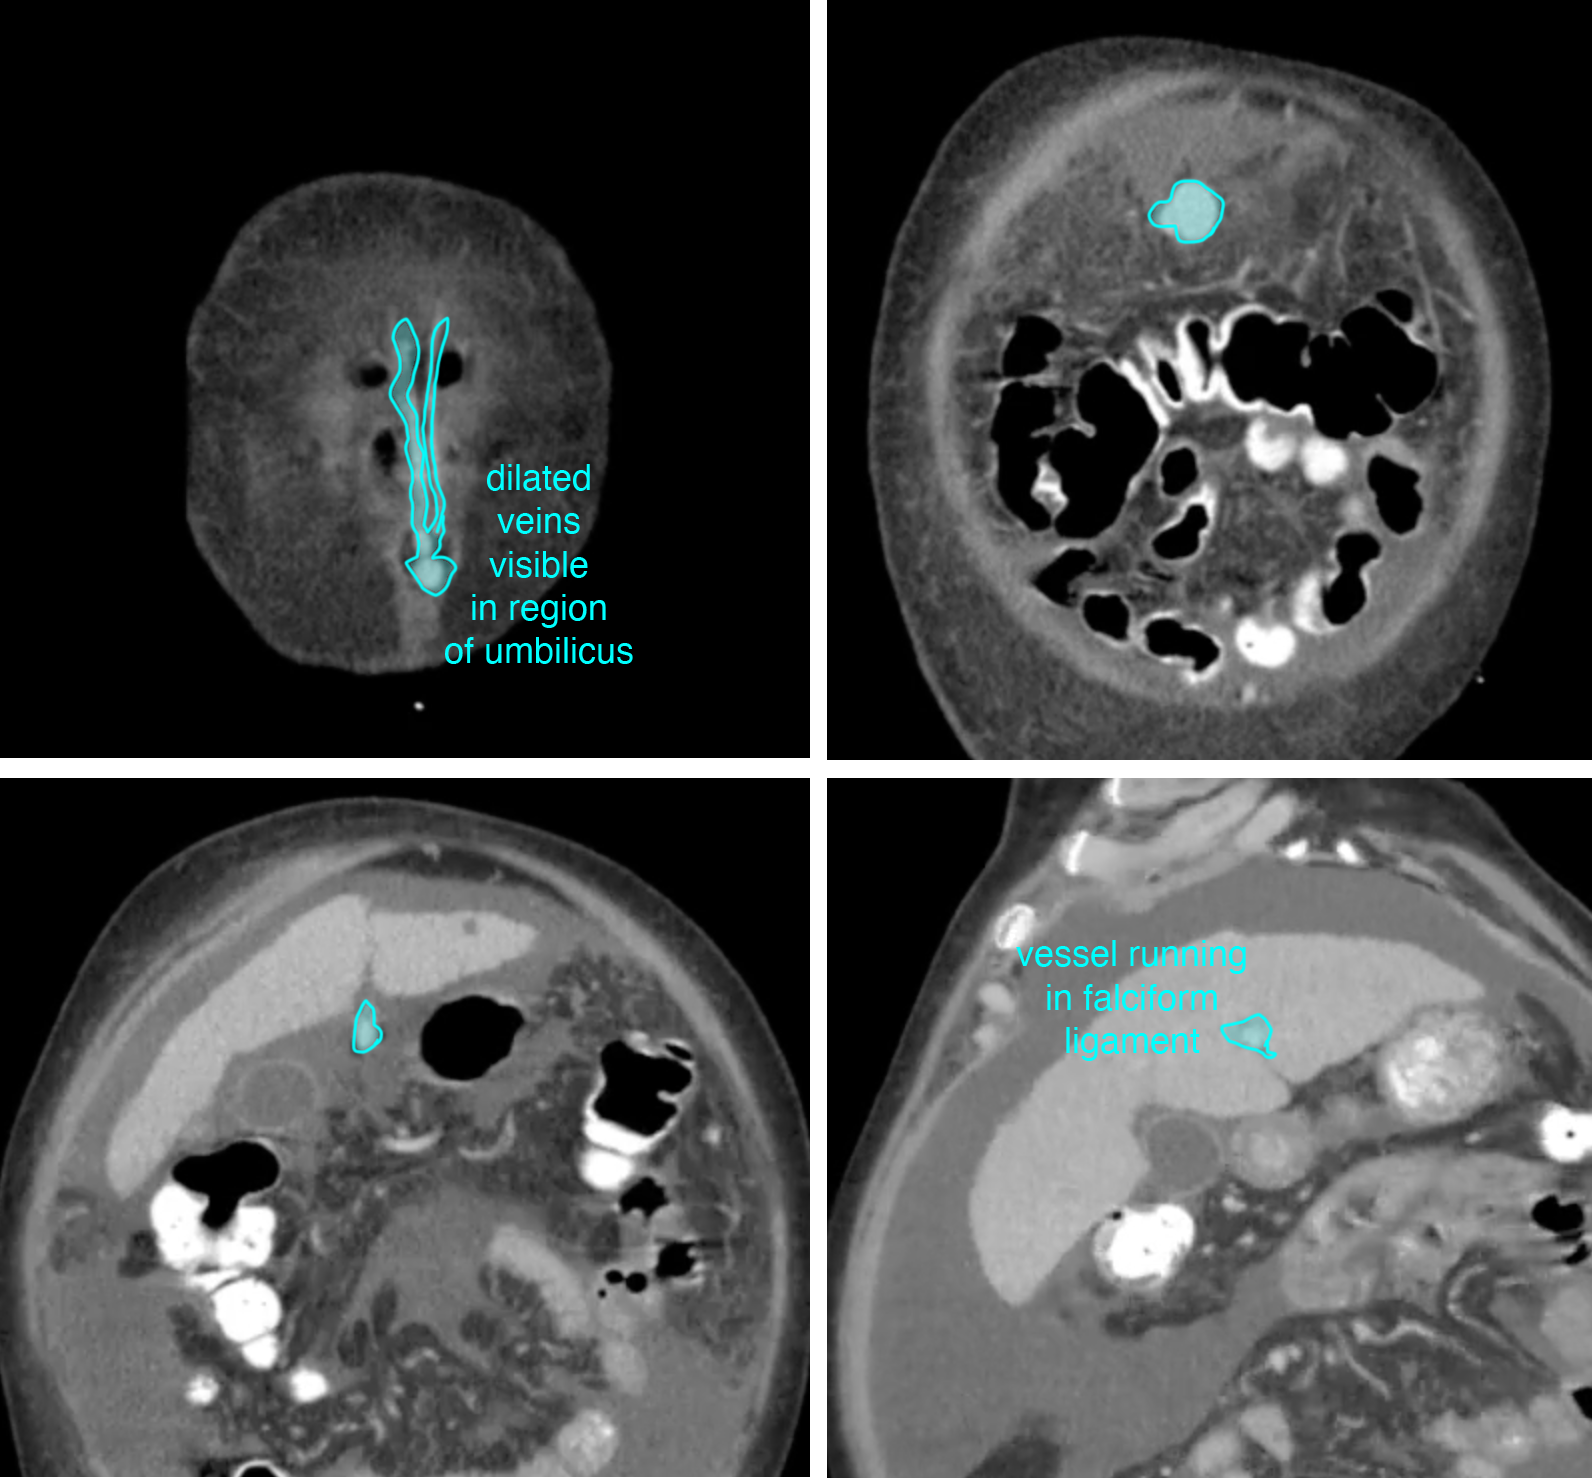
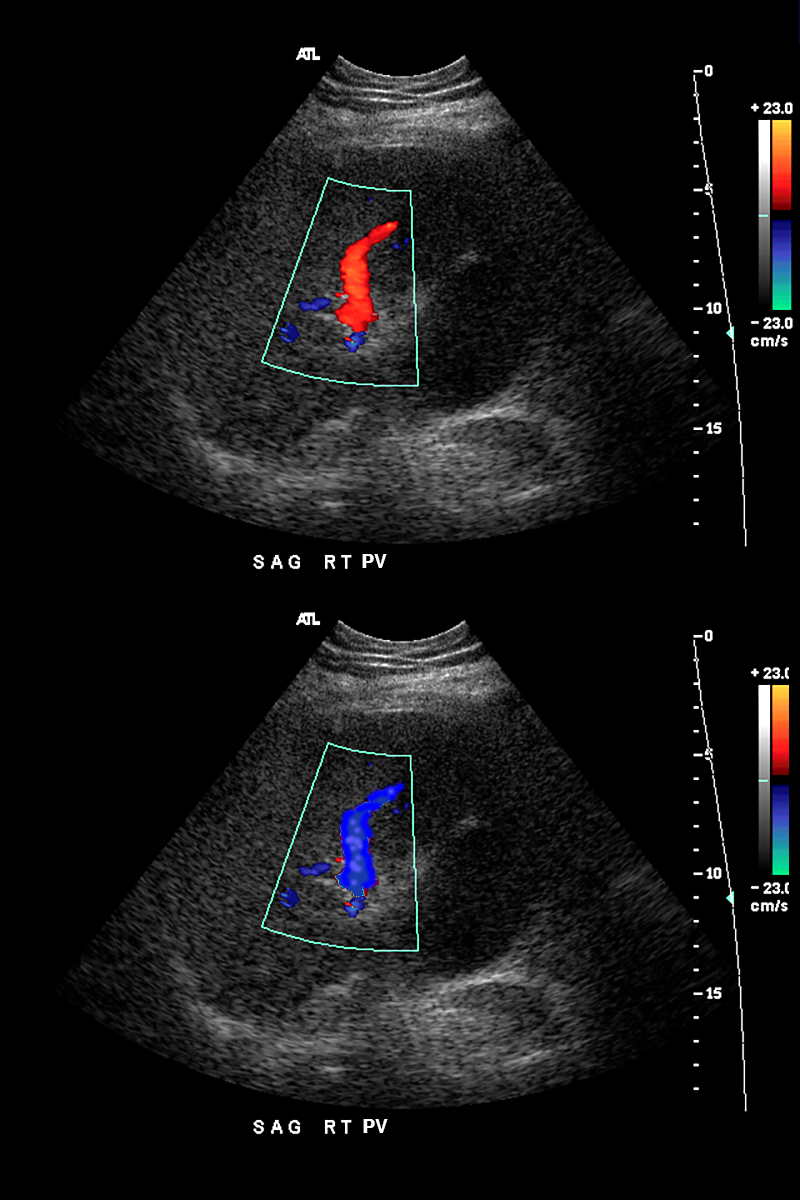
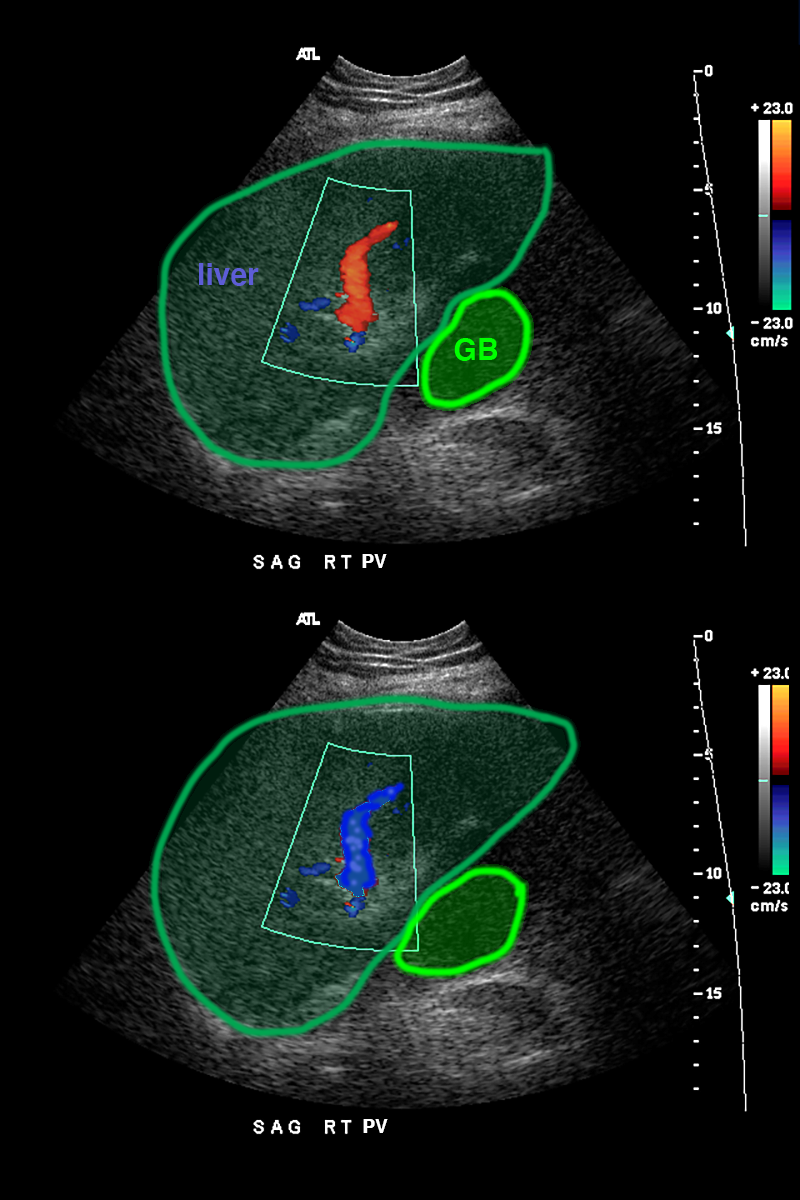
This patient has increasing abdominal girth and many other systemic symptoms. They have a significant history of alcohol use. What do you think of their liver size and appearance on these coronal images? What is the vessel that is visible in the region of their umbilicus? You are also shown two Doppler US images on different patients. Which image shows normal flow in the portal vein?
This patient has a small liver, suggestive of cirrhosis. They also have a large amount of ascites, which can be a sign of liver dysfunction. On the most anterior images of the CT, there is a dilated vessel just under the skin of the umbilicus, which appears to connect on the selected images to a vessel running in the region of the falciform ligament of the liver. This is a type of portal-systemic shunt that can form in severe cases of portal hypertension. The vessel connects the old umbilical vein to vessels on the anterior abdominal wall, relieving pressure in the portal system. The top Doppler US image shows flow from the porta hepatis out into the liver (red), which is normal. The bottom US image shows flow in the opposite direction (blue) which is not normal and indicates portal hypertension. In portal hypertension, the high pressure in the portal system can lead to retrograde flow outward from the liver and into collaterals, like esophageal varices, abdominal wall veins, or dilated veins in the region of the rectum.
Question 3:
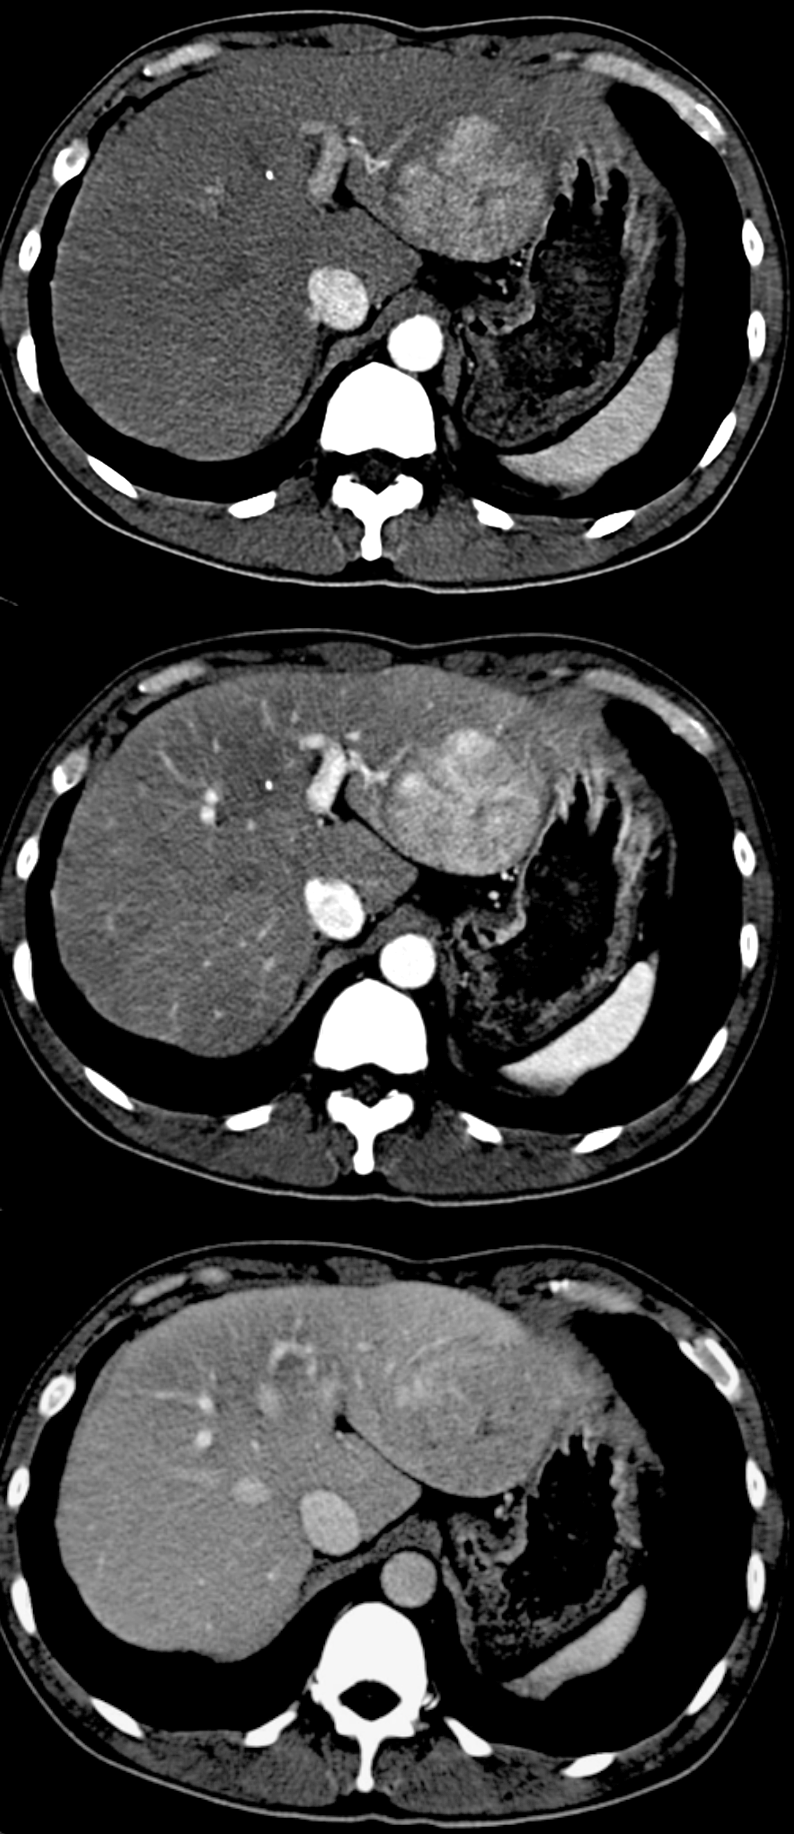
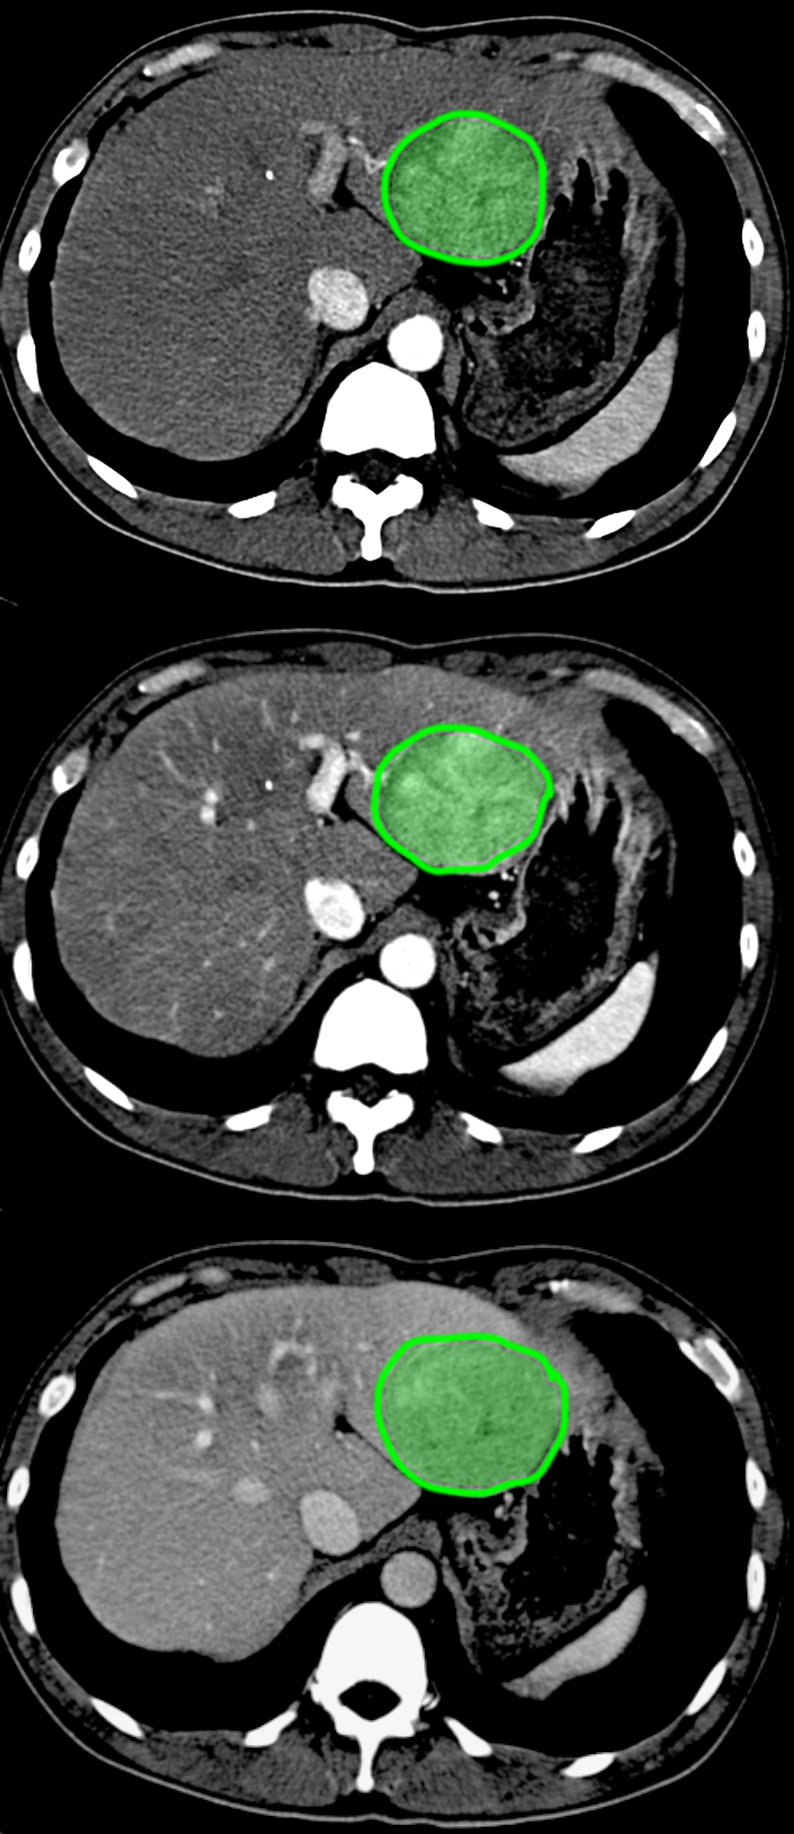
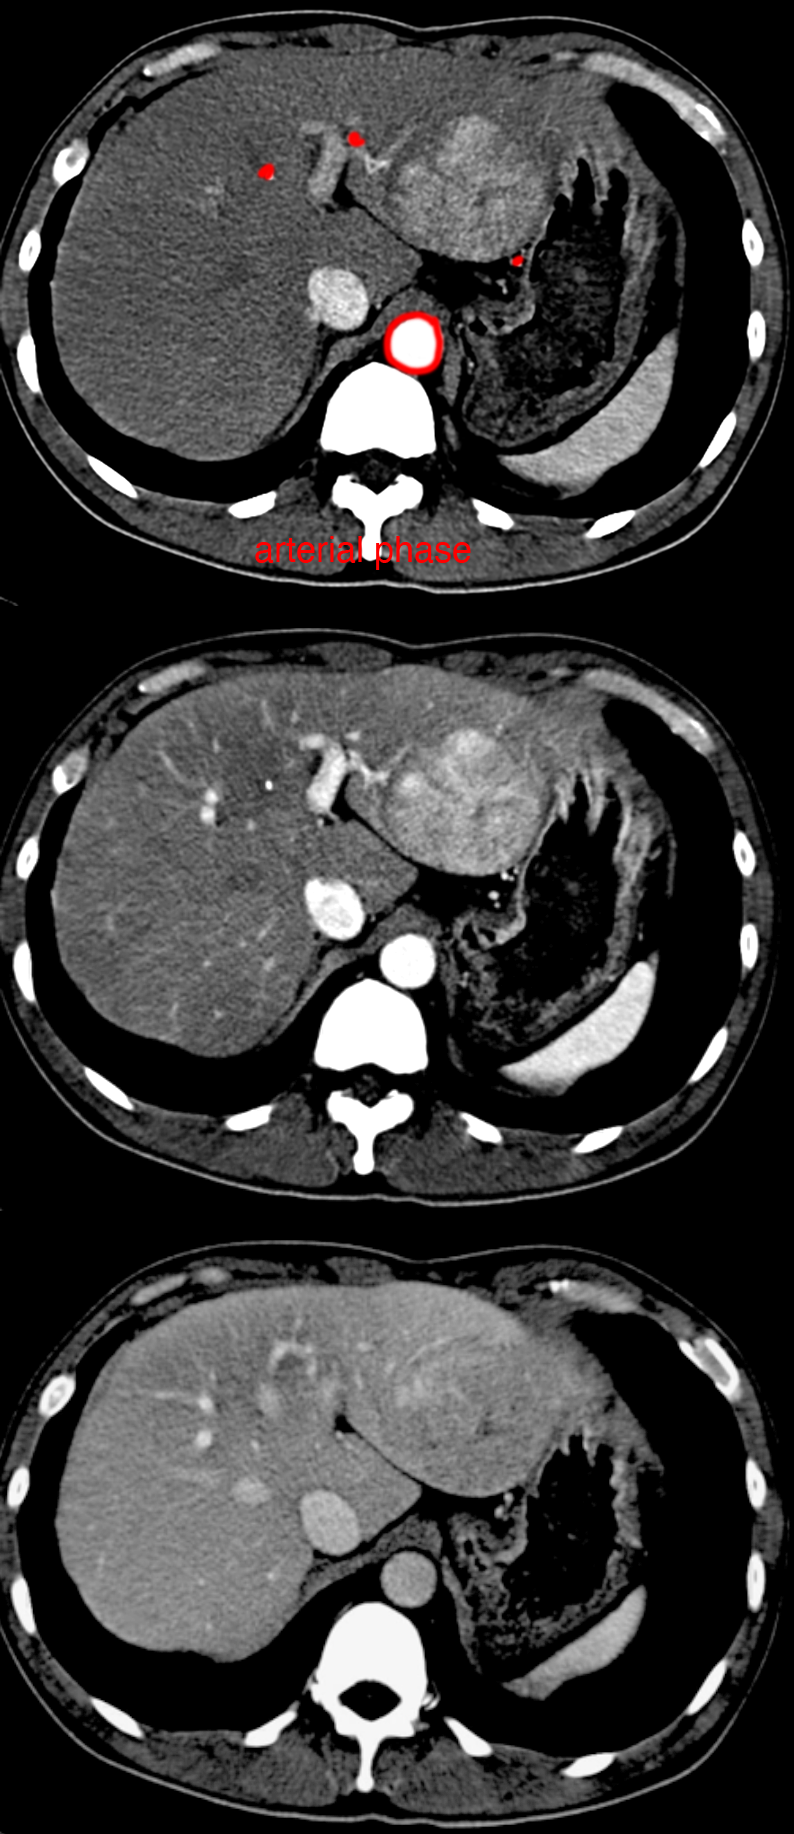
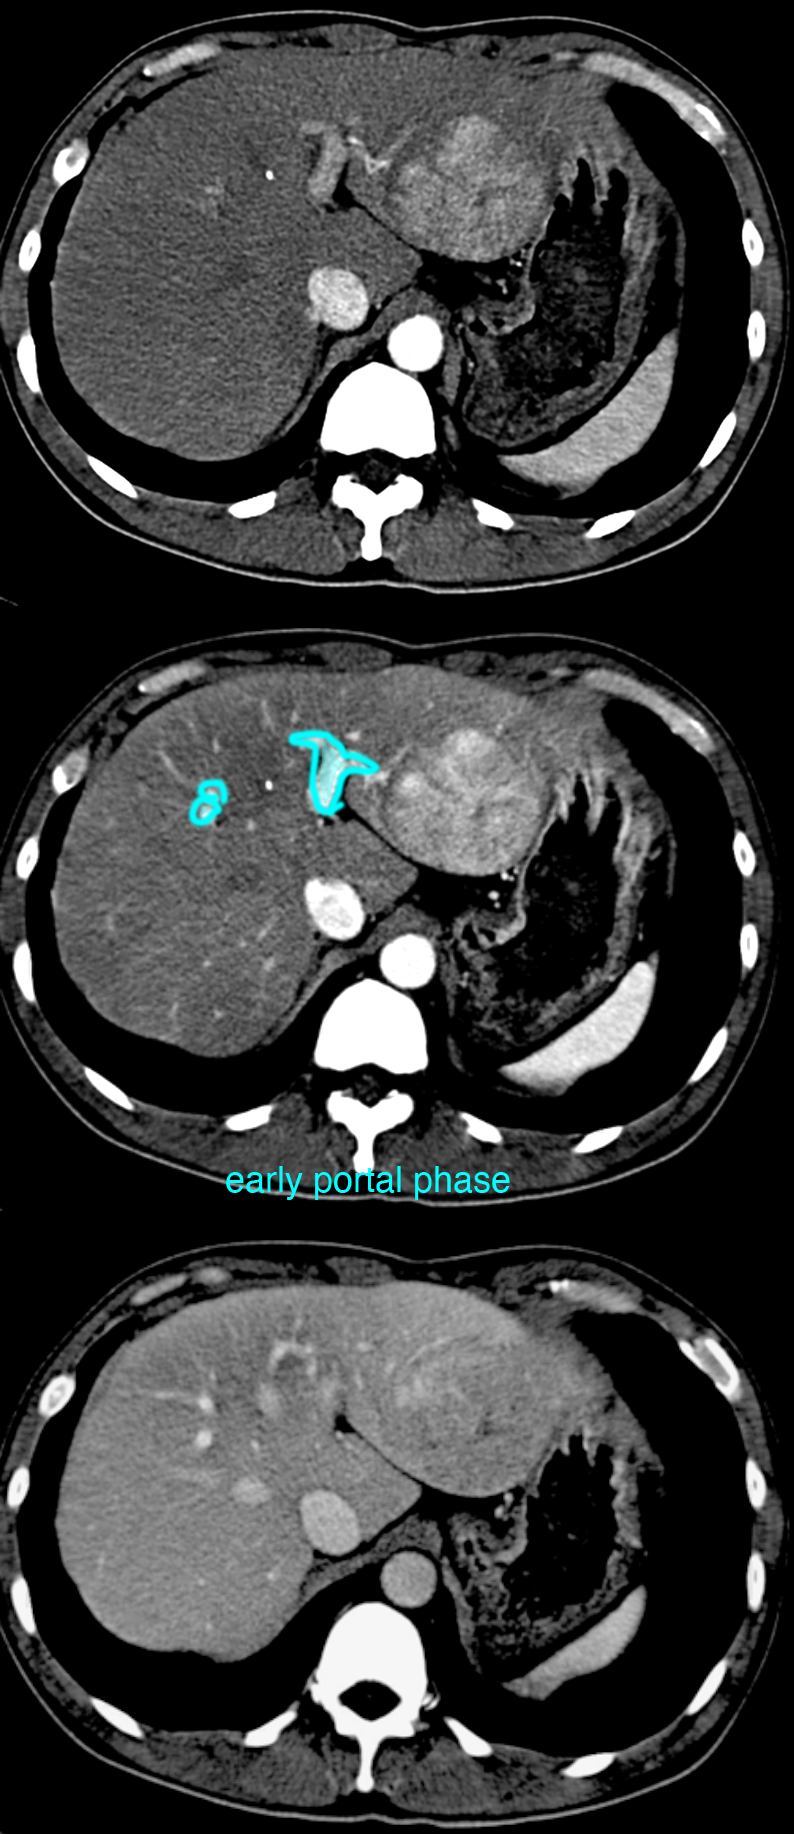
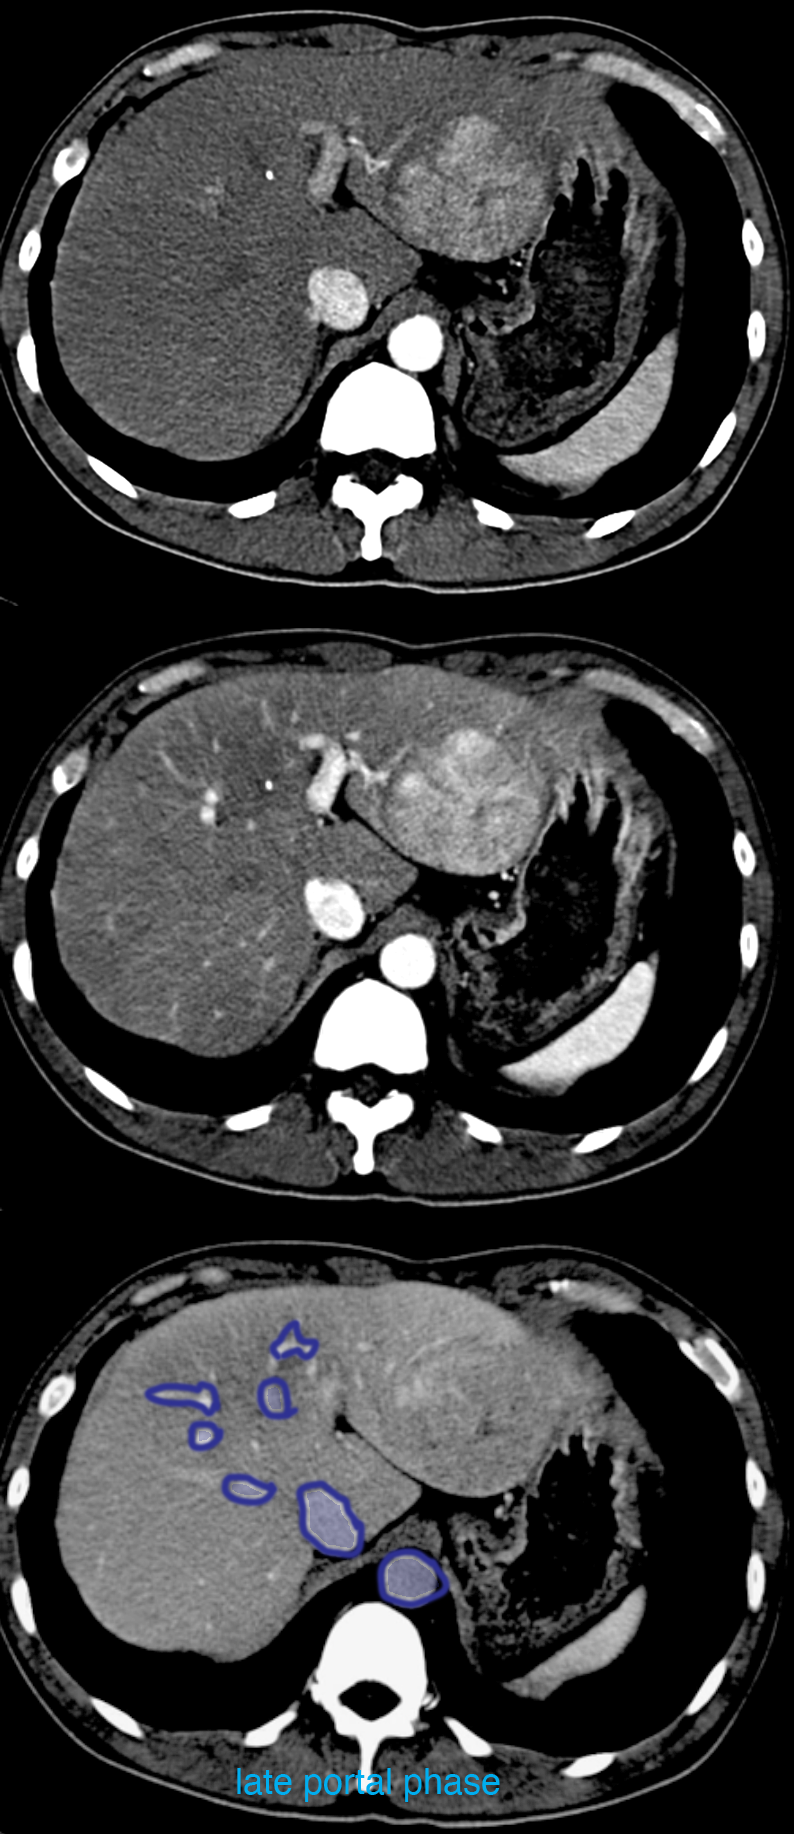
This patient had a history of hepatitis C infection, and was scanned to evaluate their liver. What phase of IV contrast is shown in each image? In what lobe is the abnormality located?
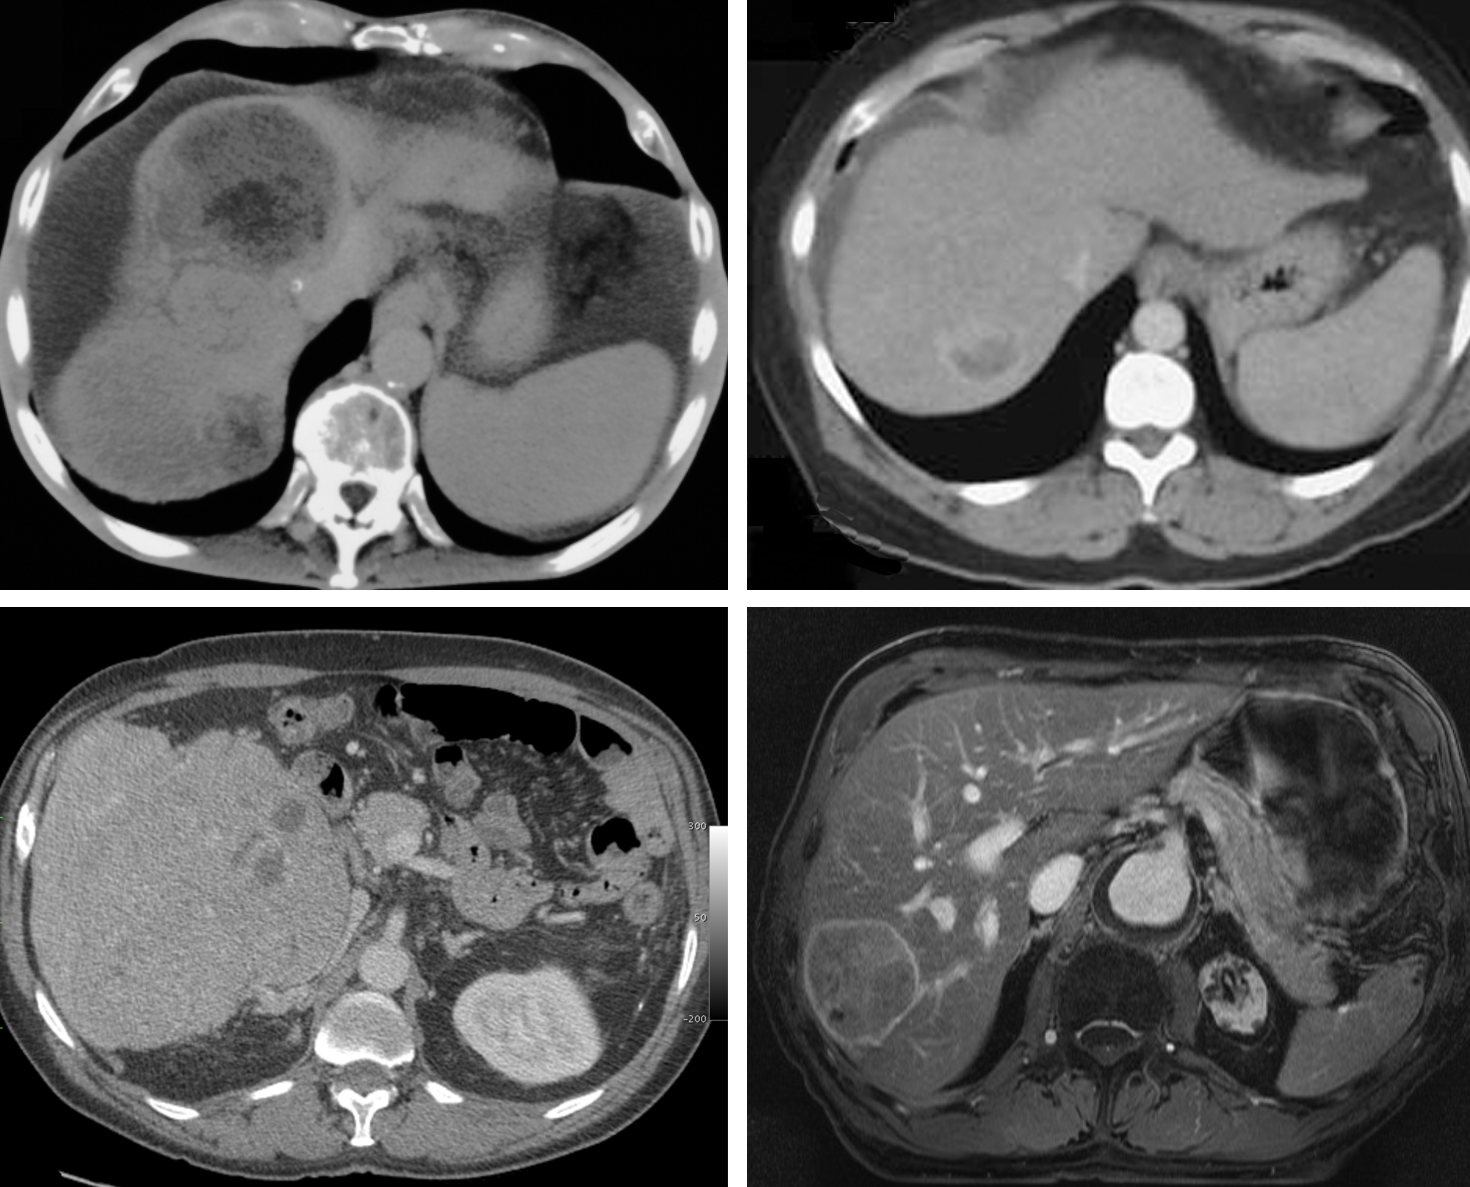
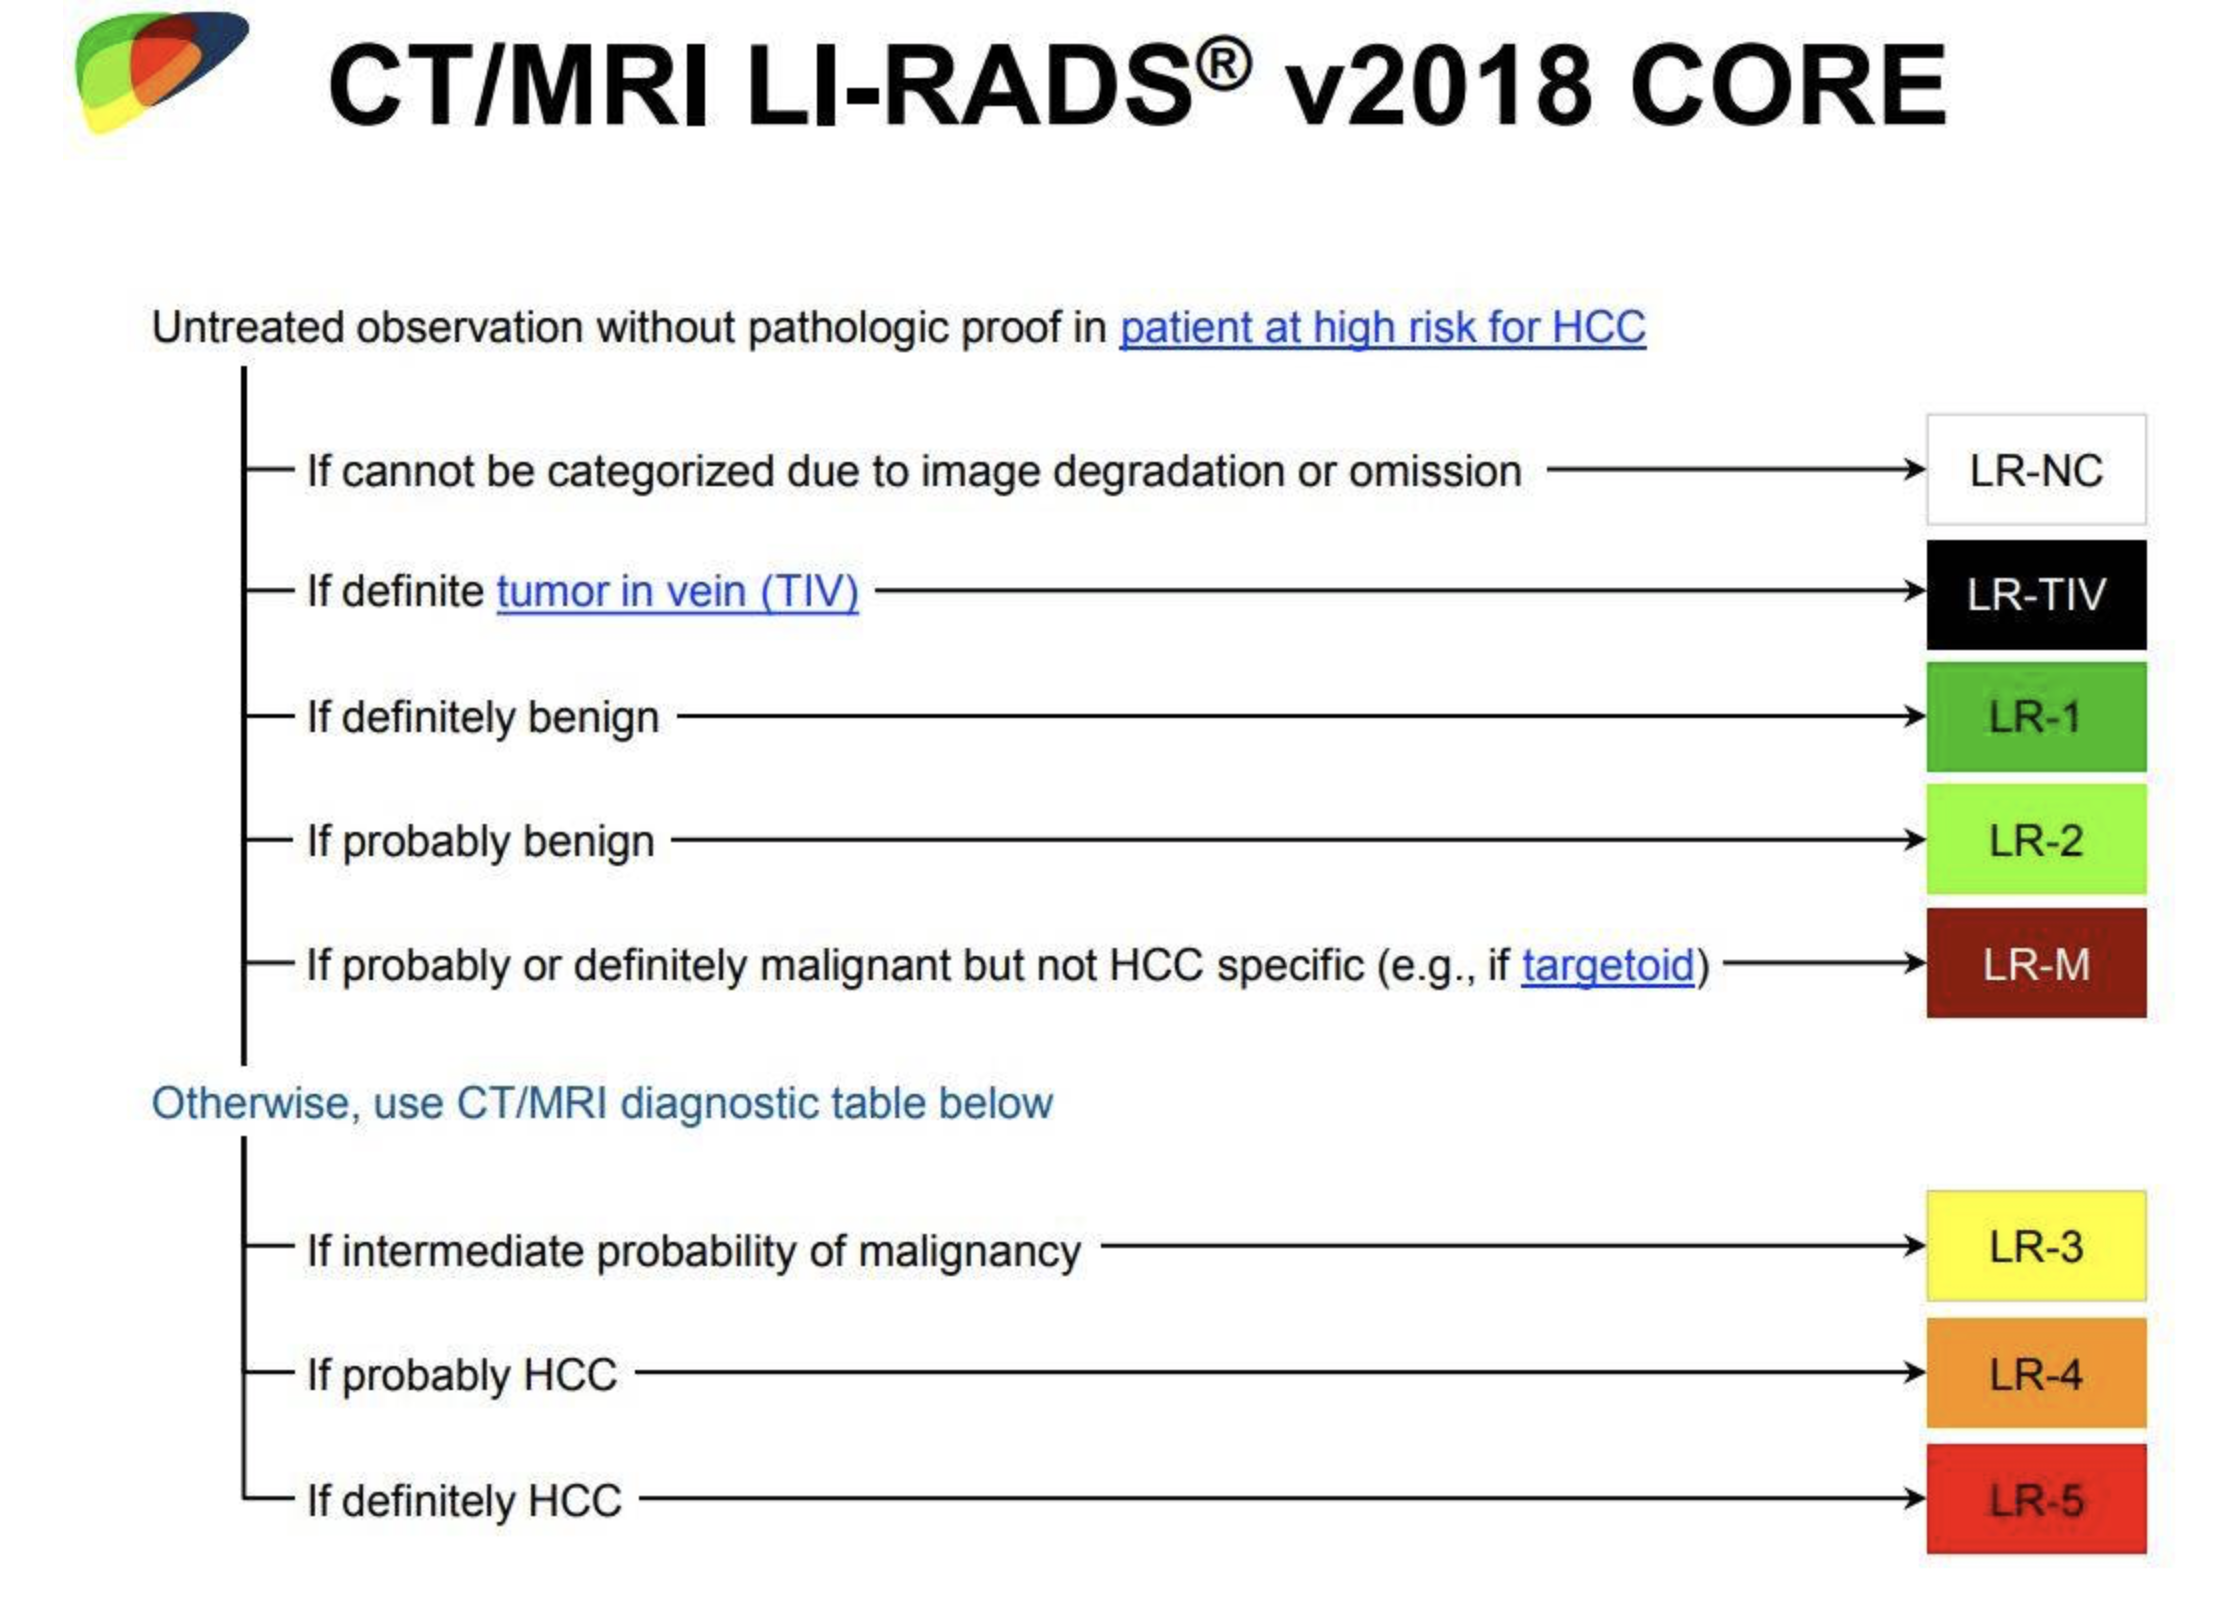
The top image is in the arterial phase, early after contrast injection. The aorta is much brighter than the portal vessels. The middle image is in the early portal phase. The portal vessels are similar in brightness to the aorta and IVC. The bottom image is in the late portal phase, when contrast is no longer so bright in vessels but has moved into the parenchyma of the liver. There is a rounded mass in the lateral portion of the left lobe of the liver, with some early arterial enhancement, but brightest in the early portal phase. The other HCC cases show the variable appearance of hepatocellular carcinoma, which makes diagnosis challenging. The ACR has developed a lexicon of terms and a classification system for liver tumors called LI-RADS, which can be helpful in distinguishing between hepatocellular carcinoma, choriocarcinoma, and liver metastases. A summary of the classification system is shown here.
Case 4-liver disease
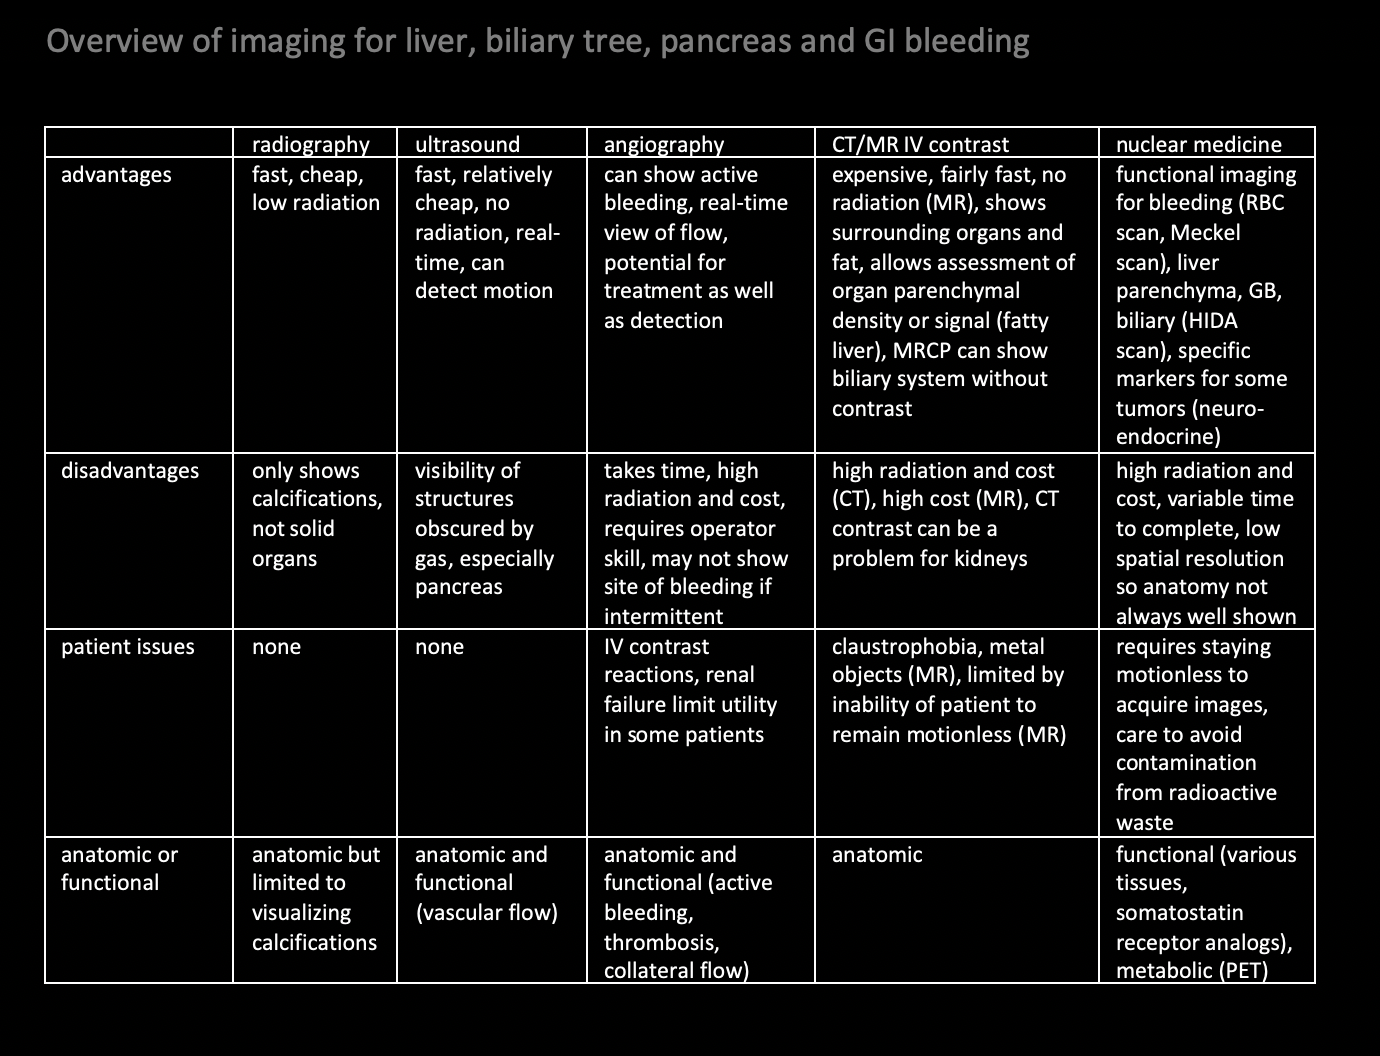
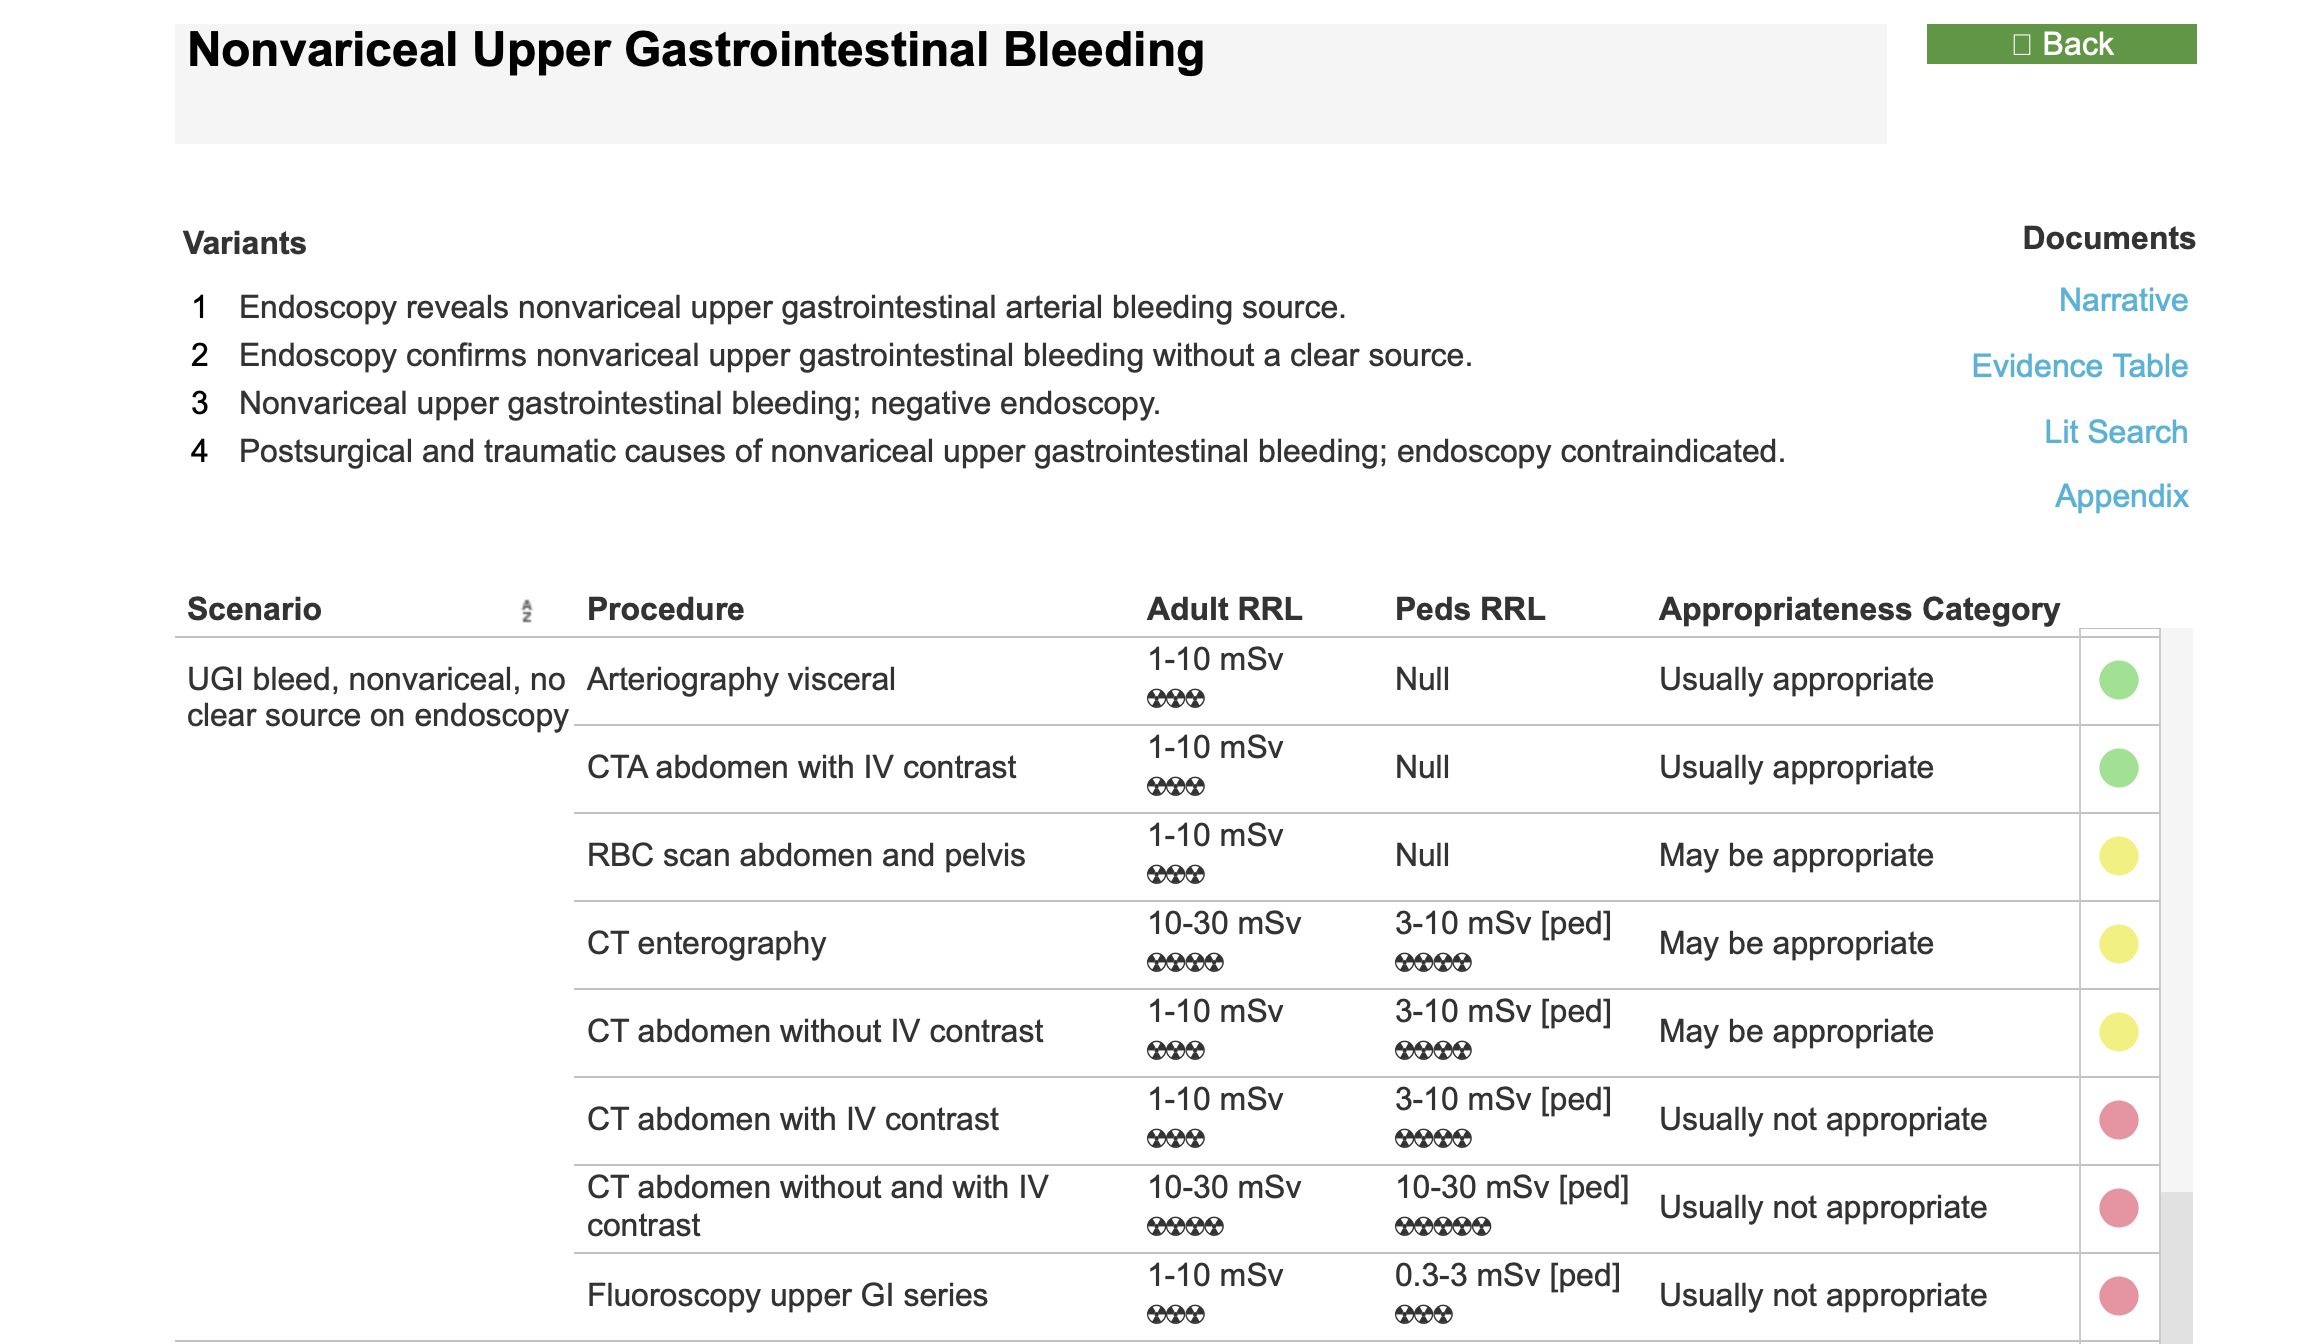
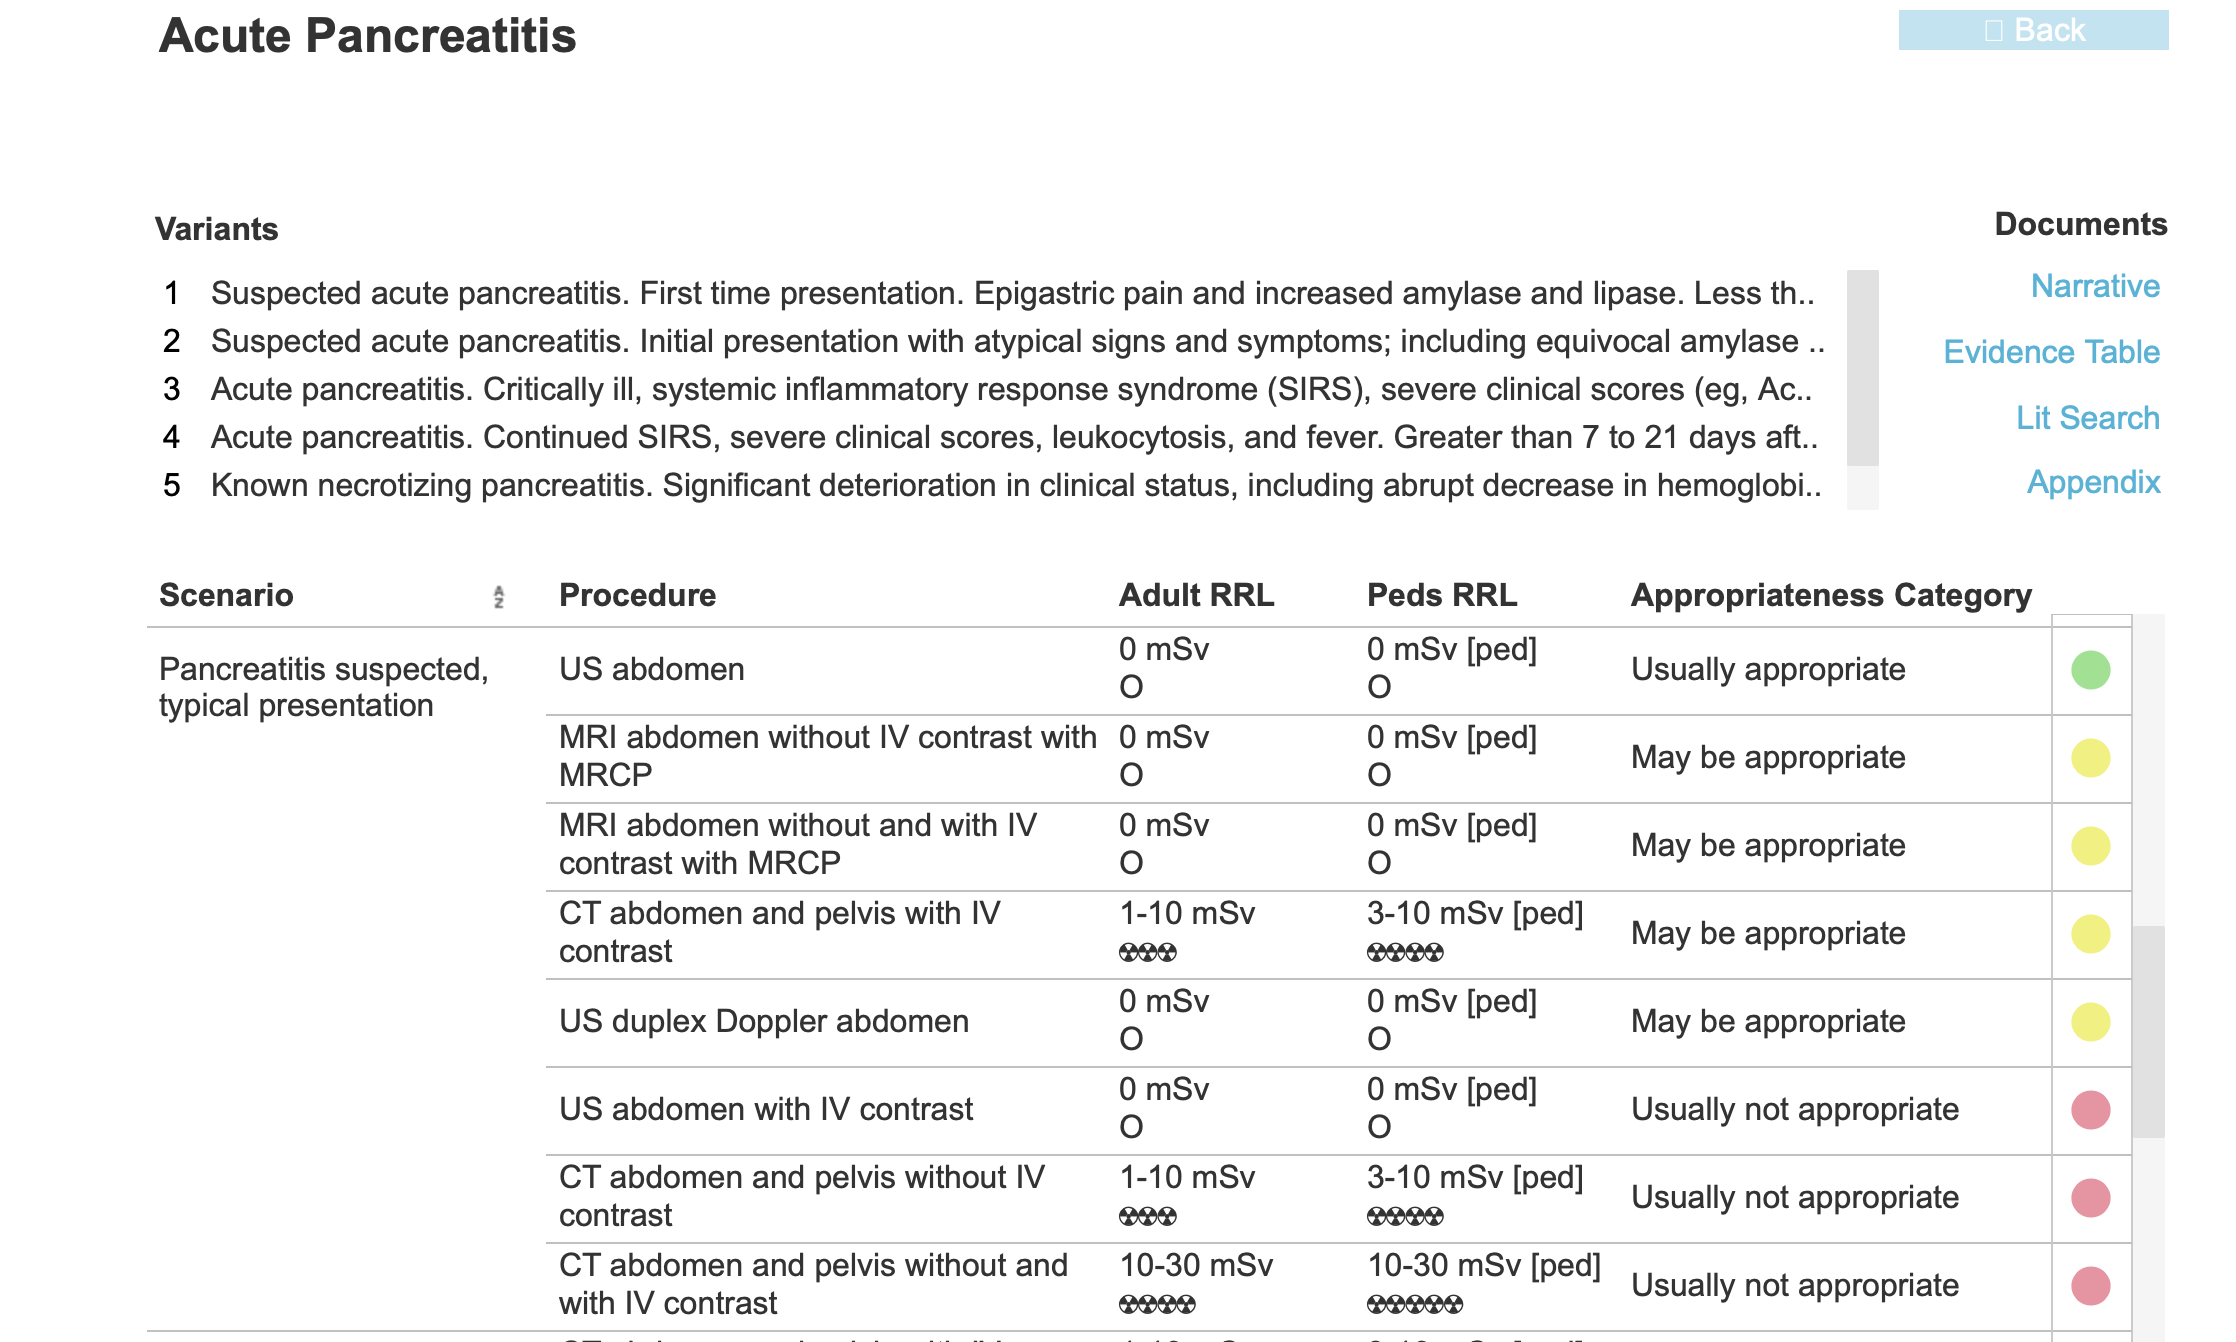
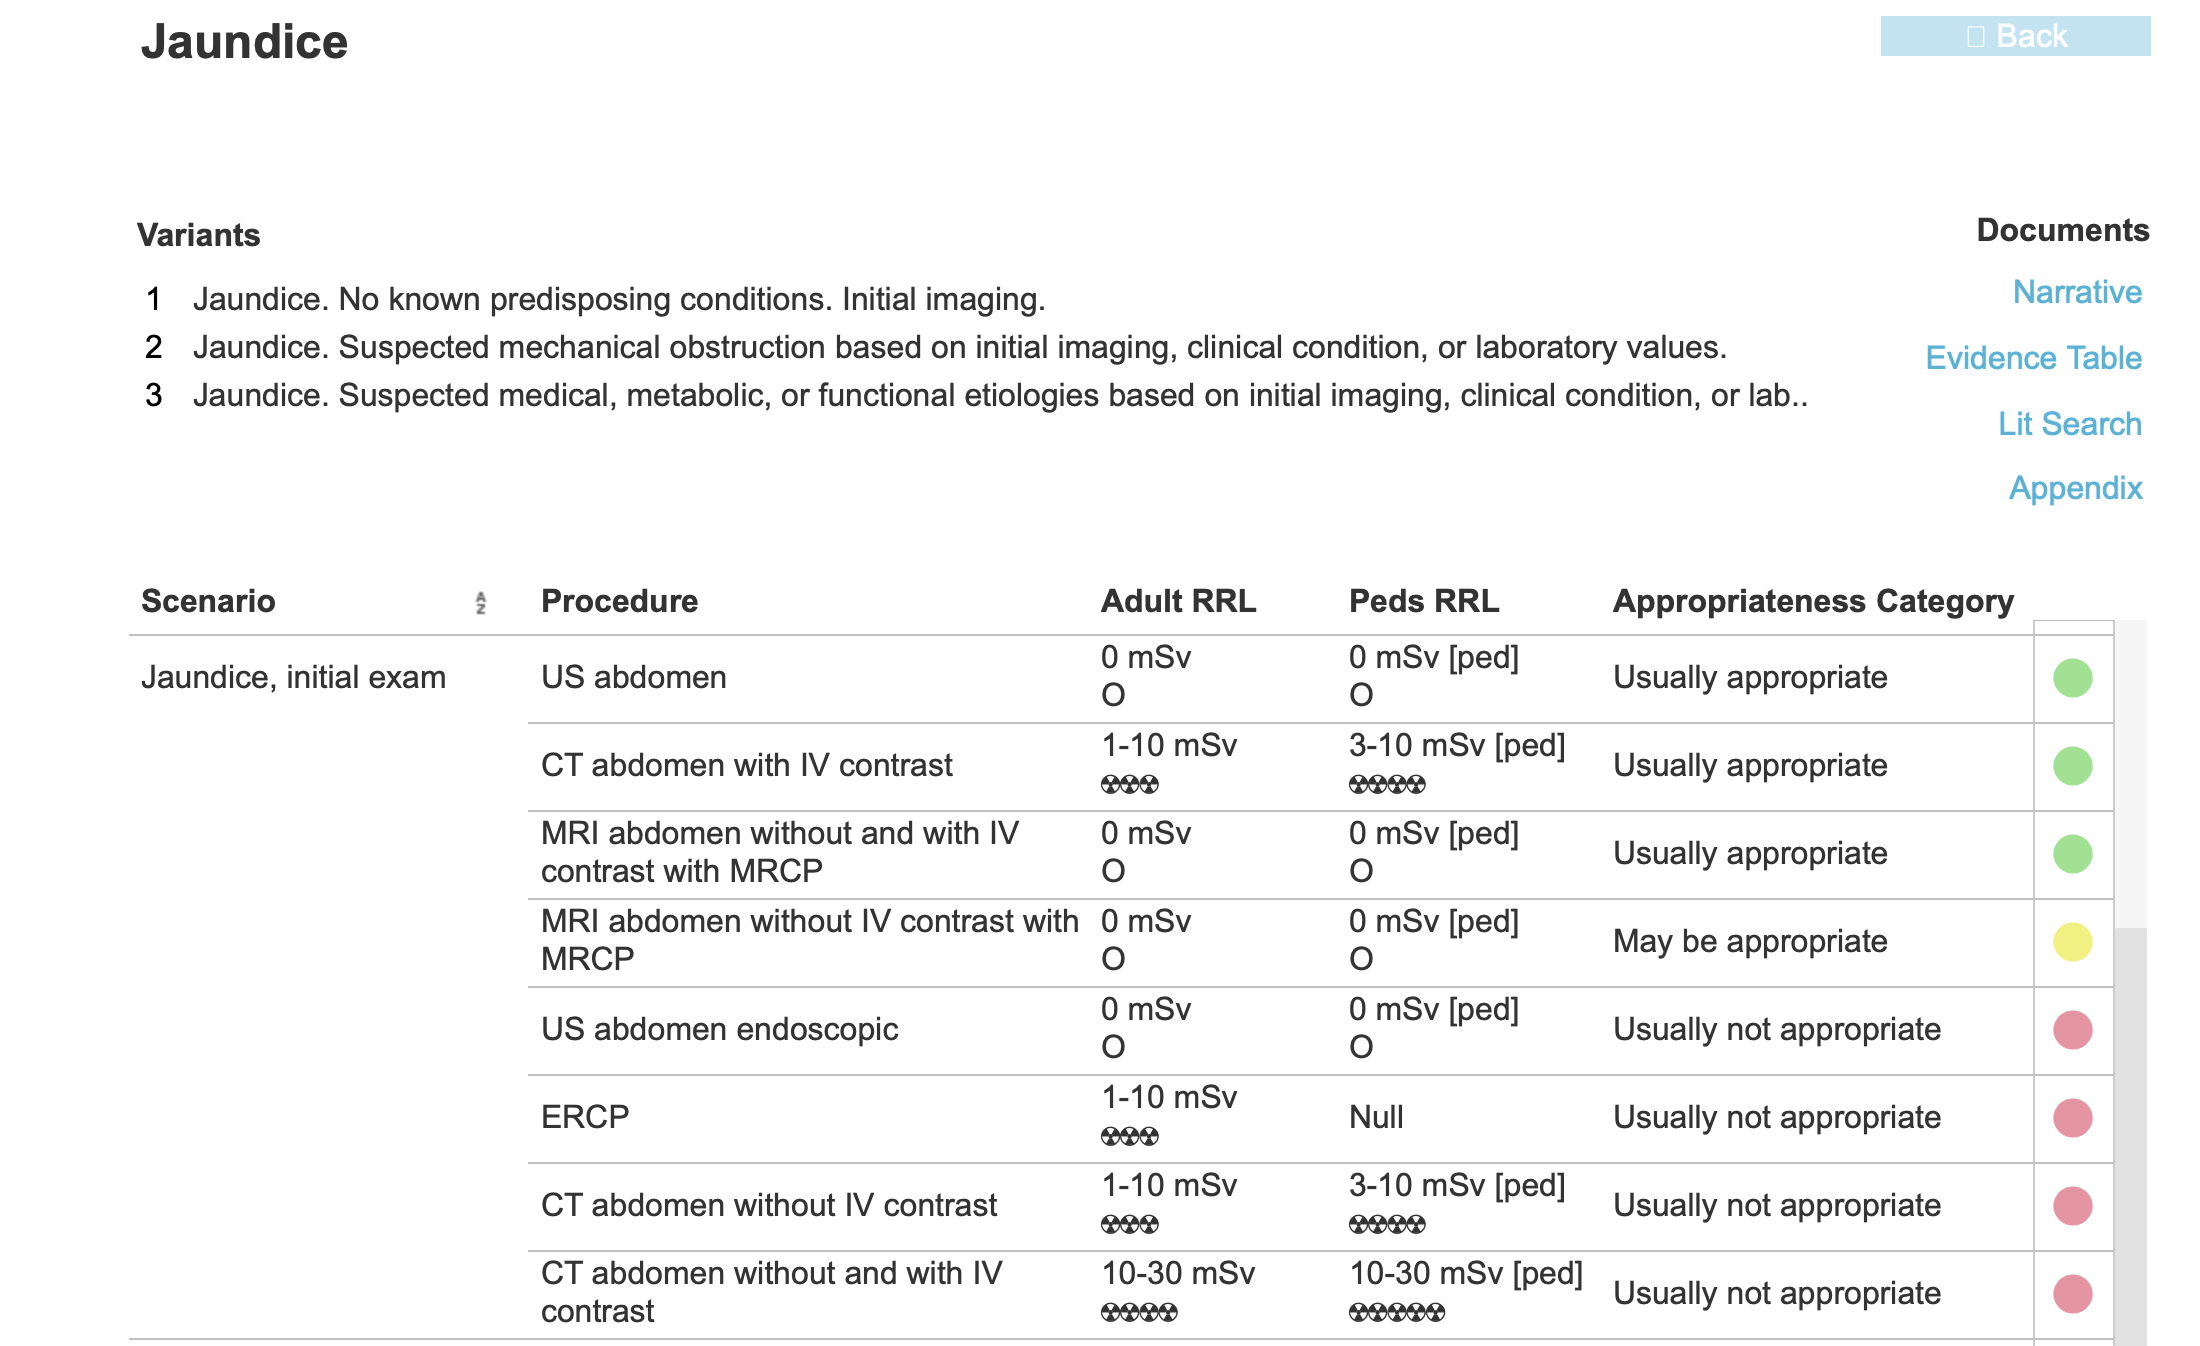
This table summarizes some of the features of imaging used in the liver, biliary tree, pancreas and for GI bleeding. Links below show ACR Appropriateness Criteria for some common presentations.
Further Explanation:
